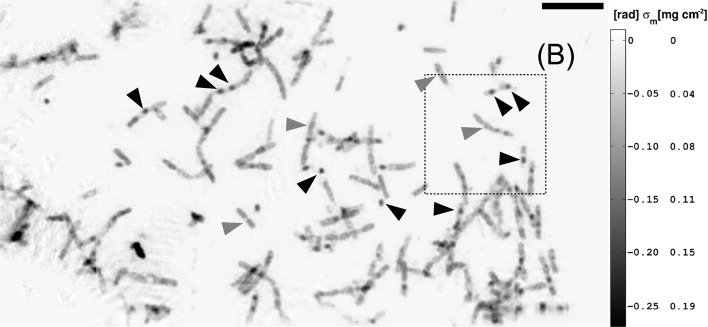
Figure 5.
Region (A): the image shows a phase map of the B. thuringiensis sample. The phase map corresponds to four single mHIO reconstructions that have been merged in the same plane. Grey arrow heads point to some of the rod-shaped remnant cell material. The black arrow heads indicate electron-dense cellular features such as endospores. The dashed black frame indicates region (B), including (C), of the sample (cf. Fig. 7 ▶). The scale bar denotes 10 µm.

