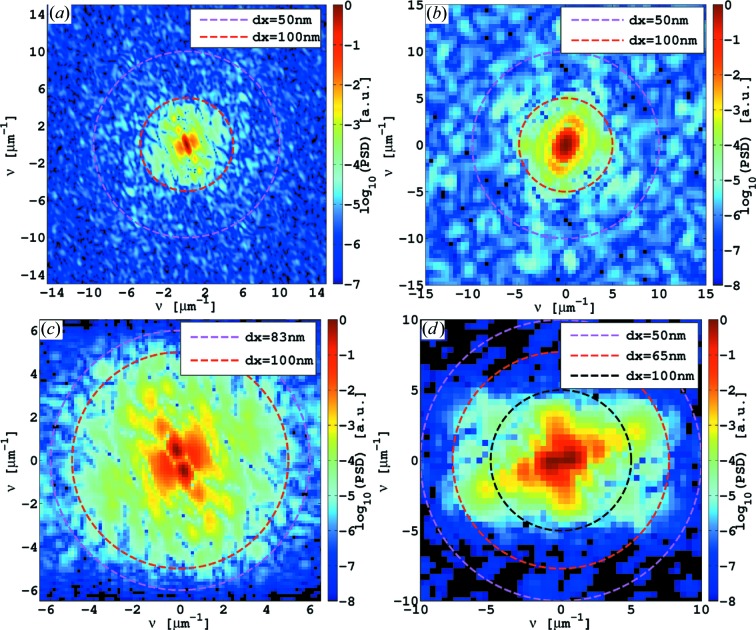
Figure 6.
(a) and (b) PSDs of mHIO reconstructions of B. thuringiensis [region (C), Fig. 7 ▶(b)] and B. subtilis data [region (B), Fig. 8 ▶(b)], indicating resolutions in the range of 100 nm (half-period). (c) and (d) PSDs of CTF-based reconstructions of the B. thuringiensis data [region (C), Fig. 9 ▶(b)] and B. subtilis data [region (A), Fig. 10 ▶], indicating resolutions of about 100 and 60 nm (half-period), respectively.

