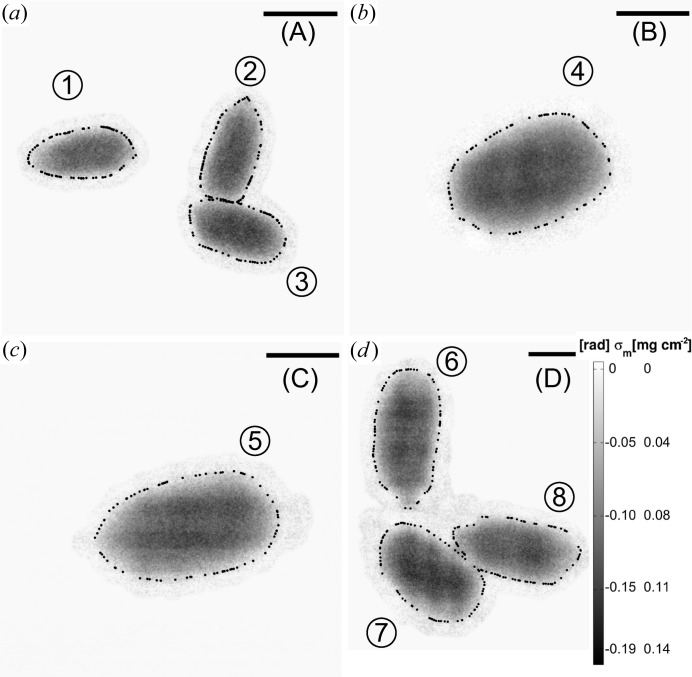
Figure 8.
The figure presents mHIO phase reconstructions of endospores of B. subtilis of regions (A), (B), (C), (D) (cf. Fig. 3 ▶
b). The endospores are labelled from (1) to (8). The black dots indicate the boundaries used for mass estimations. The average mass per single endospore is  (7) fg. The colour bar is the same in (a), (b) and (c) as in (d). The scale bars in (a), (b), (c) and (d) denote 1, 0.5, 0.5 and 0.5 µm, respectively.

