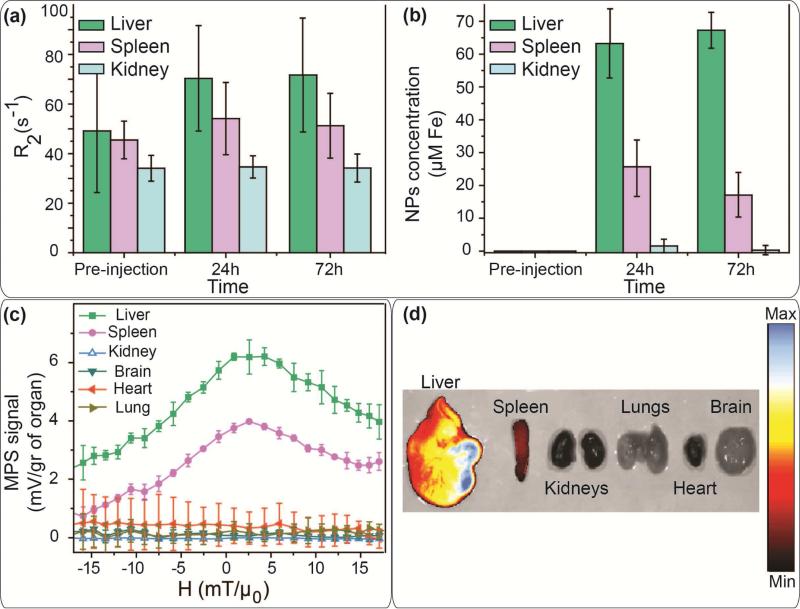
Fig. 6.
(a) R2 values calculated form the change of the T2 contrast of the organs in live mice used for calculation of the concentration of the NPs functionalized with NH2-PEGFMOC in each organ (b). Biodistribution of these NPs determined by (c) MPS and (d) IVIS NIRF scanning of the excised organs of the mice sacrificed 72 hours after injection of the NPs. MPS, NIRF and MRI results show a similar mice biodistribution pattern for the injected NPs. A major part of the NPs were accumulated in liver. The remaining fraction of the NPs was detected in spleen, without any signal in kidney, brain, heart and lungs.

