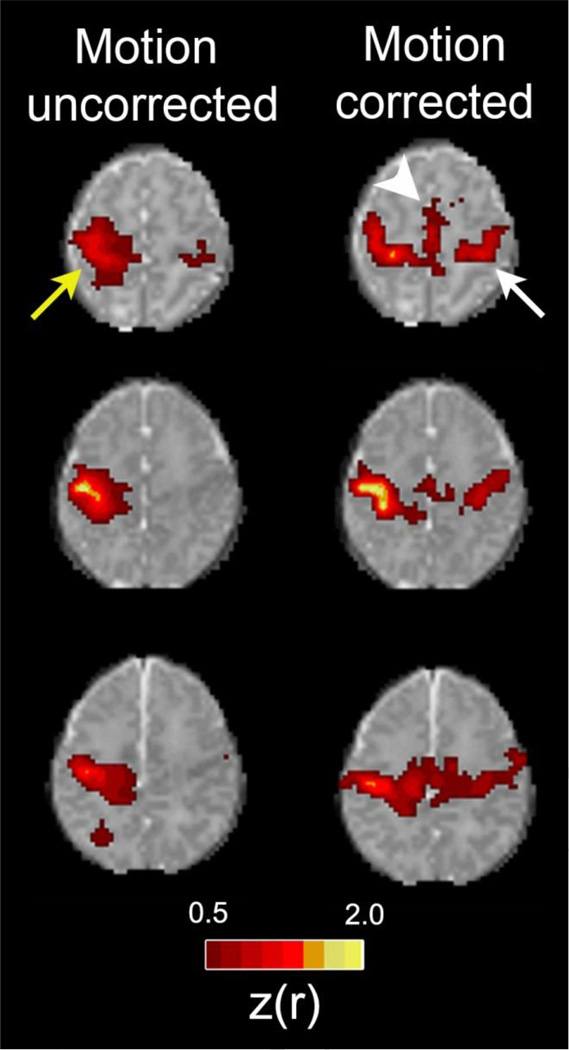
Figure 1. Improvements in rs-fMRI results using rigorous motion correction procedures.
Each row shows rs-fMRI correlation maps illustrating the motor network for one of three representative healthy, term control infants. The left column shows data derived using all frames acquired during the course of all single scanning session. The right column shows data derived only from frames remaining following rigorous frame censoring procedures. For motion correction, frames were excluded if the volume-to-volume head displacement was ≥ 0.25 mm or the root mean squared BOLD signal intensity change (DVARS) was ≥ 0.3%. Images depict Fisher z-transformed correlation coefficients obtained using a left motor cortex seed (z(r); color threshold value = 0.5). Identical slices are shown in both columns for each subject. Note the larger local area of correlation near the seed in the uncorrected data (yellow arrow). Note also that longer range connections to the contralateral motor area (white arrow) and supplemental motor area (white arrowhead) are not detected in the uncorrected data.

