
Figure 4.
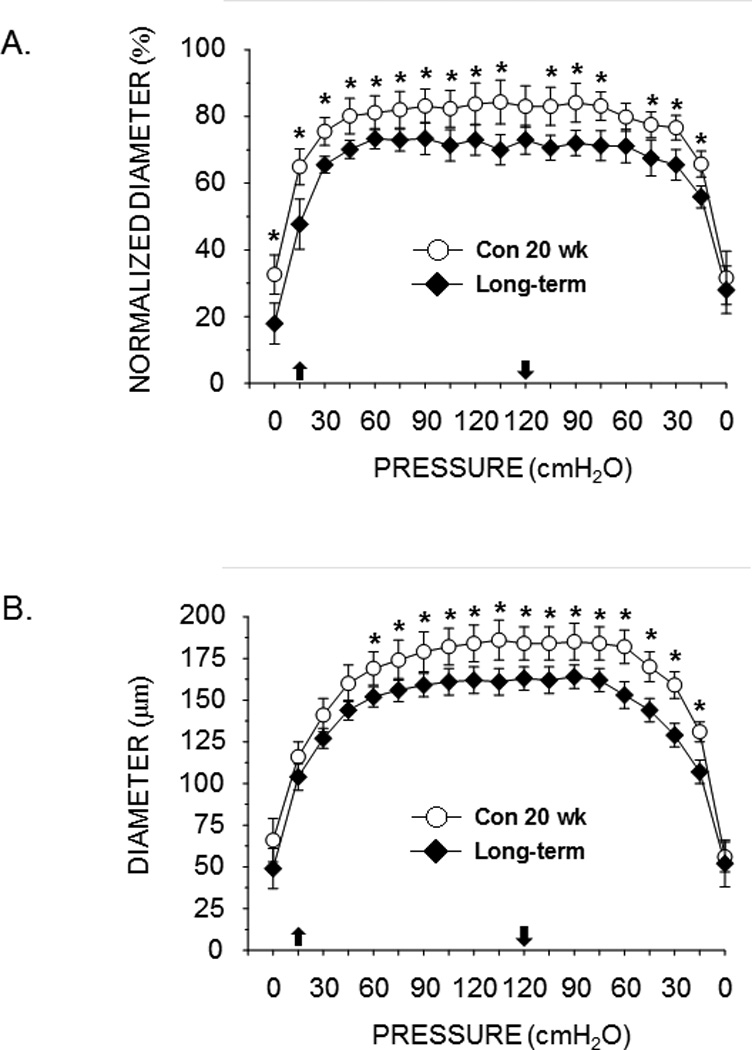
Effects of long-term diabetes on active myogenic vasoconstriction (A) and the passive pressure-diameter relation (B) of the femoral principal nutrient artery. Upward pointing arrow indicates where pressure began to be increased; downward arrow indicates where pressure began to be lowered. Values are means ± SE, n = 13–14/group. *Mean PNA response from 20 wk obese ZDF rats is different from that of 20 wk lean ZDF rats (P<0.05).