
Figure 6.
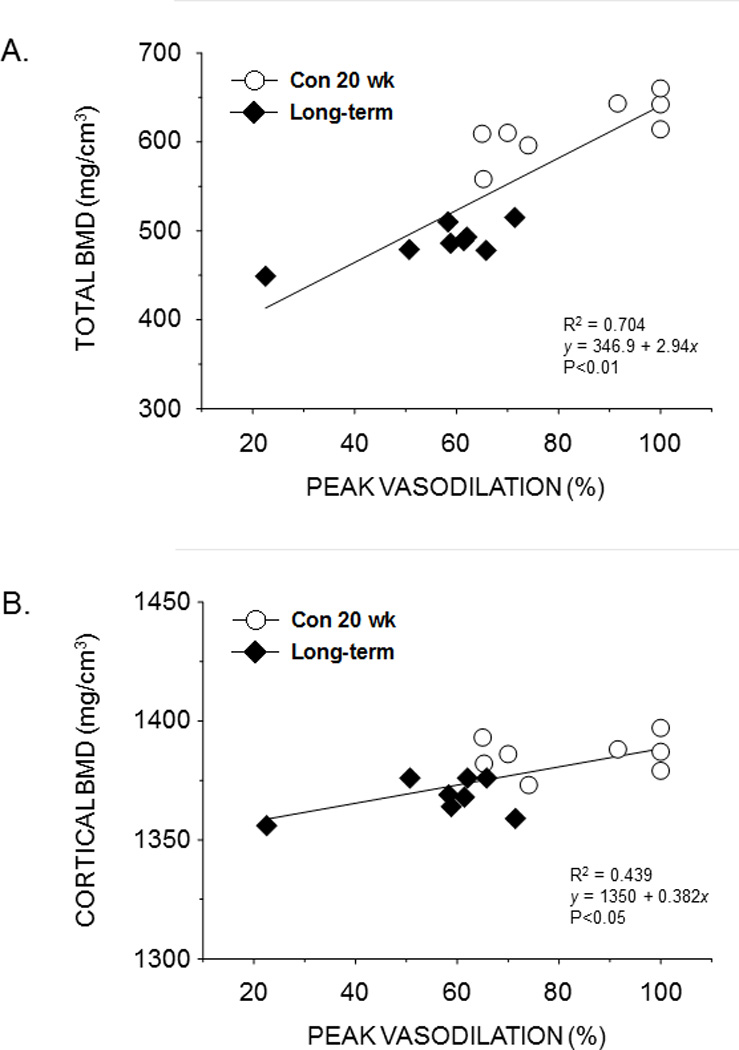
Scattergrams showing the relation between total bone mineral density (BMD) of the distal femur (A) and cortical BMD of the femoral mid-shaft (B) with peak endothelium-dependent vasodilation of the femoral PNA from lean and obese ZDF rats with long-term diabetes. A significant linear relation (P< 0.05) exists between total and cortical BMD and peak PNA vasodilation.