
Figure 7.
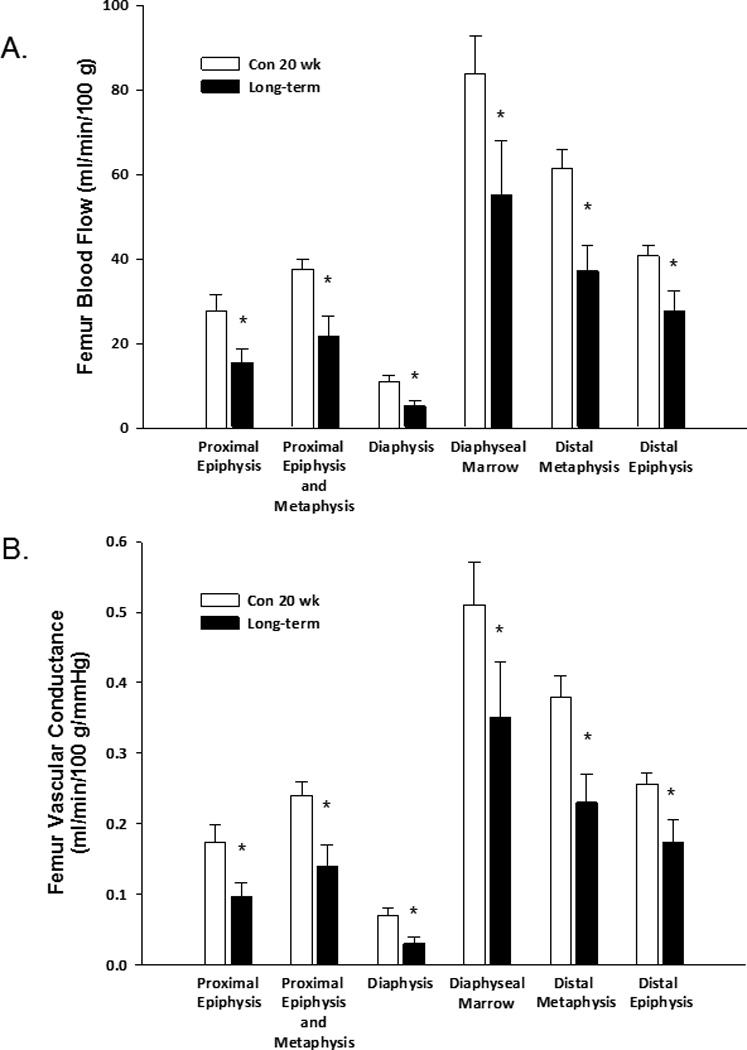
Effects of long-term diabetes on regional femoral blood flow (A) and vascular conductance (B). Values are means ± SE, n = 12/group. *Mean is different from age-matched, non-diabetic control animals (P< 0.05).
Official websites use .gov
A
.gov website belongs to an official
government organization in the United States.
Secure .gov websites use HTTPS
A lock (
) or https:// means you've safely
connected to the .gov website. Share sensitive
information only on official, secure websites.
Effects of long-term diabetes on regional femoral blood flow (A) and vascular conductance (B). Values are means ± SE, n = 12/group. *Mean is different from age-matched, non-diabetic control animals (P< 0.05).