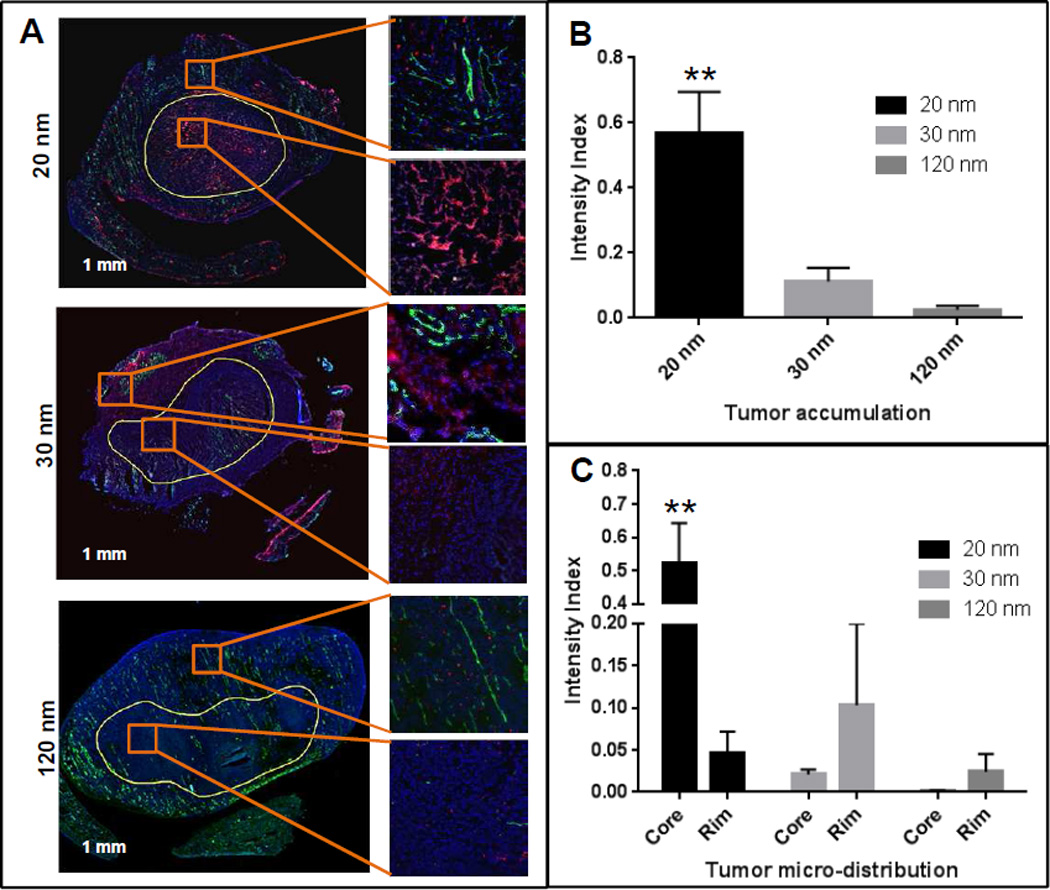
Figure 5.

Nanoparticle microdistribution in the tumors treated with the 20, 30 and 120 nm DiI labeled NPs. Tumor sections were stained with FITC-anti CD31 Ab and DAPI and scanned with TISSUEscope. Differential accumulation was found between tumor core and perivascular region. (A) Tumor sections treated with different sized nanoparticles. Red (DiI-PPT-NPs), green (FITC-CD31, vascular endothelium) and blue (DAPI, nuclei). (B) Overall DiI fluorescence intensity (normalized against DAPI) in tumors. ** p < 0.01 vs 120 nm. (C) Microdistribution of DiI signal in the core (hypovascular) and rim (hypervascular) of the tumors. ** p < 0.01 vs Rim. Data = mean ± SEM (n=3).
