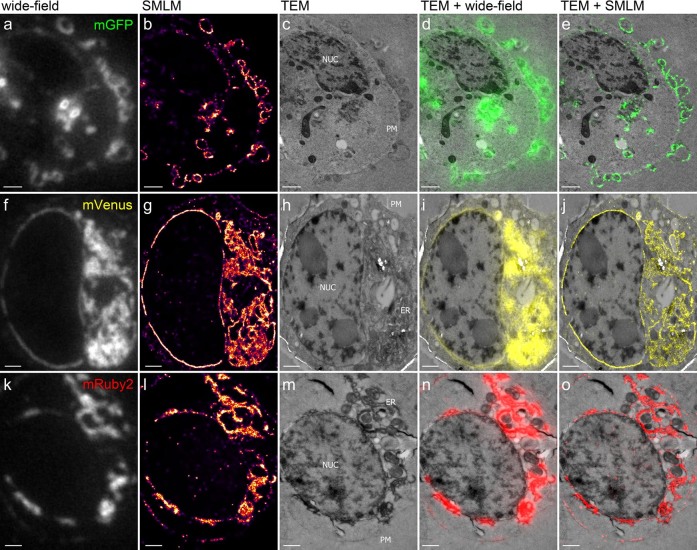
Figure 3. Correlative in-resin super-resolution fluorescence and EM imaging of HEK293T cells transfected with EphA2/A4 receptor proteins fused to mGFP, mVenus or mRuby2.
The first column shows conventional wide-field fluorescence images, the second column the corresponding SMLM images with color coded local densities of detected molecules and the corresponding Nyquist limited resolution (the same color code as in Fig. 2f and Fig. 4f applies). TEM images of the same cells are depicted in the third column (plasma membrane (PM), ER and the nucleus (NUC) are indicated in the individual images), followed by an overlay of the TEM images with the conventional wide-field fluorescence images, and an overlay of TEM and SMLM images. Scale bars are 1 μm. The freeze substitution for these cells was performed with 0.1% TA.

