. 2015 Mar;18(1):19–26. doi: 10.3831/KPI.2015.18.002

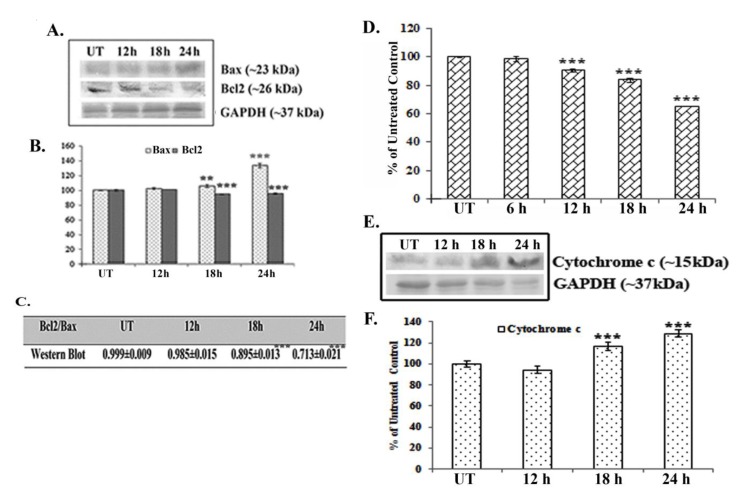
Fig. 3. Analysis of Bax-Bcl2 expression and mitochondrial membrane potential after quercetin exposure. (A) Western blots of Bax and Bcl2 and (B) band intensities of Bax and Bcl2 were observed. Statistical significance was considered as *P < 0.01 or P < 0.001. (C) The ratio of Bax to Bcl2 was determined. Statistical significance was considered as †P < 0.001. (D) Flu FluorimetryFluorometric analysis of the mitochondrial membrane potential after staining with rhodamine 123. Values are means ± SDs of three independent experiments with six replicates each. Statistical significance was considered as P < 0.001. (E) Western blots of cytochrome c and GAPDH were done and (F) relative band intensities were calculated. Statistical significance was considered as P < 0.001. Here, UT represents the untreated cells.

Fig. 3