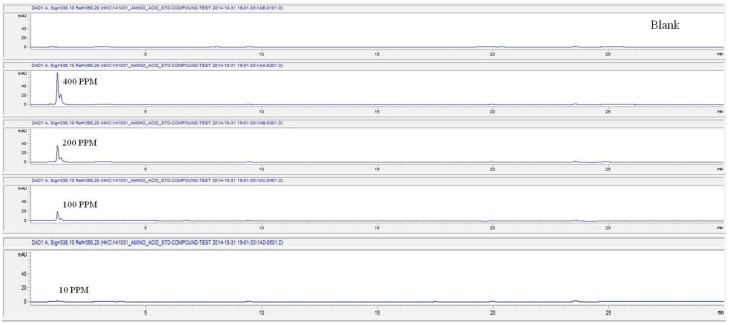
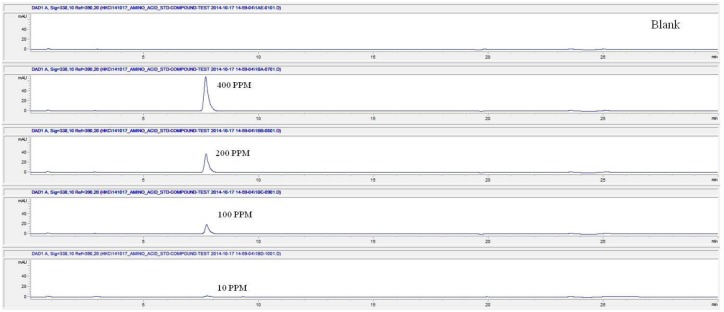
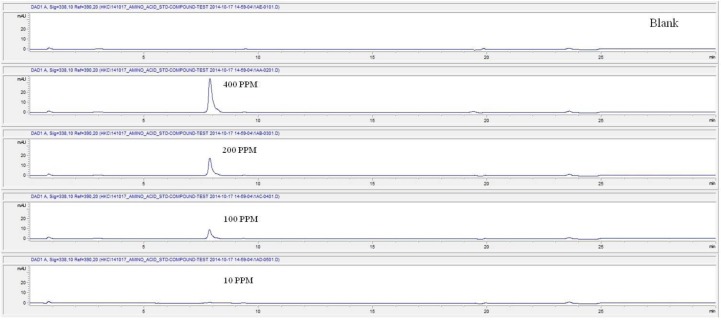
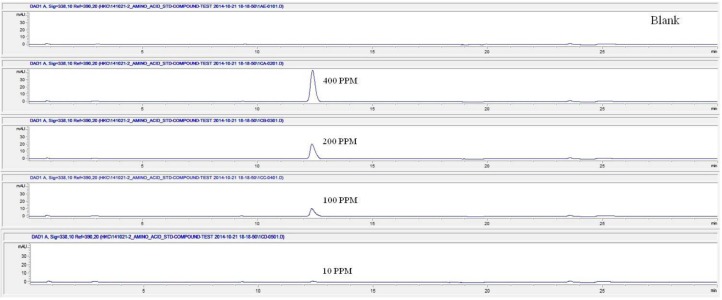
Fig. 3a. Chromatograms of aspartate STD for concentrations of 400, 200, 100, and 10 ppm.
Fig. 3b. Chromatograms of arginine STD for concentrations of 400, 200, 100, and 10 ppm.
Fig. 3c. Chromatograms of alanine STD for concentrations of 400, 200, 100, and 10 ppm.
Fig. 3d. Chromatograms of aspartate STD for concentrations of 400, 200, 100, and 10 ppm.
Fig. 3e. Chromatograms of lysine STD for concentrations of 400, 200, 100, and 10 ppm.


