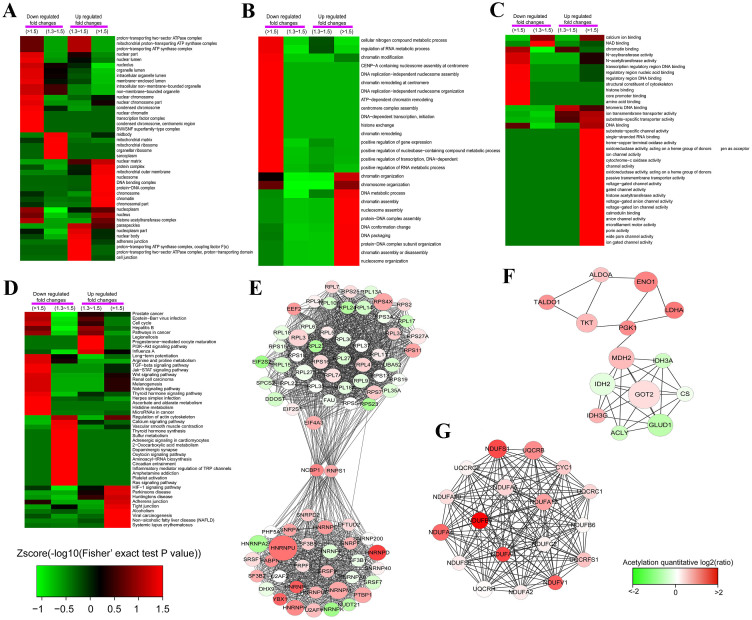
Figure 4. Functional enrichment-based clustering analysis for the quantified acetylome.
(A), cellular component analysis. (B), biological process analysis. (C), molecular function analysis. (D), KEGG pathway analysis. (E), protein-protein interaction network of acetylated proteins clustered in ribosome and spliceosome. (F), protein-protein interaction network of acetylated proteins clustered in TCA cycle. (G), protein-protein interaction network of acetylated proteins clustered in oxidation phosphorylation.

