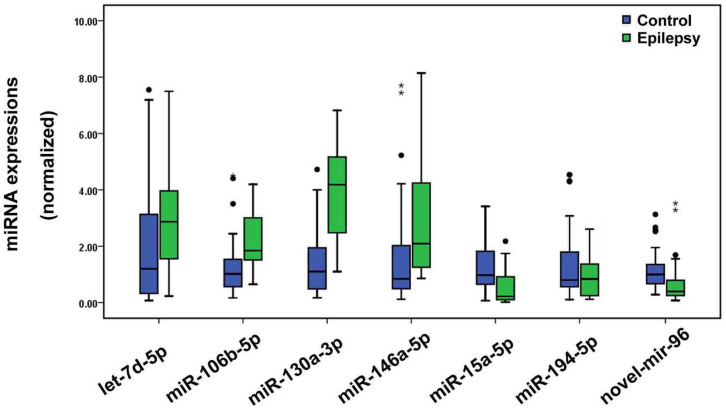
Figure 2. Differential expression levels of significant miRNAs in training phase.
Expression levels of the miRNAs were normalized to spiked-in cel-miR-39 and were calculated utilizing the 2−ΔΔCt method. Mann-Whitney U test was used to determine statistical significance. The black dots and stars represent the outliers. The black dots: Values > Qu + 1.5IQR; the stars: Values > Qu + 3.0IQR. Qu, upper quartile; IQR, inter-quartile range.

