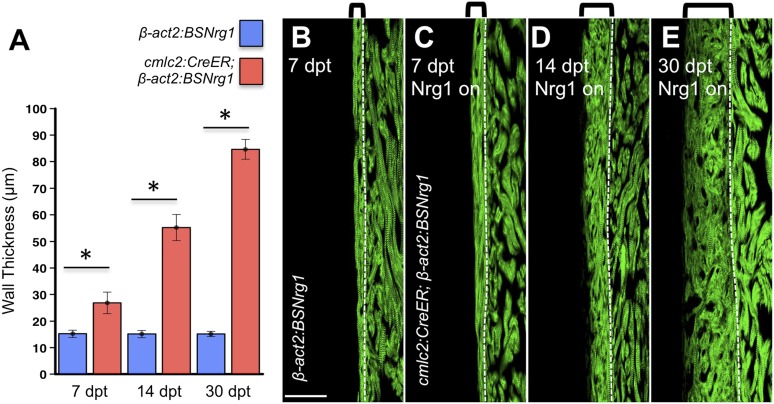
Figure 4. Nrg1-induced cardiomyocyte proliferation expands the ventricular wall.
(A) Quantification of cortical muscle thickness at 7 (n = 8, 9), 14 (n = 10, 11), and 30 dpt (n = 11, 11). Data are represented as mean ± SEM. *p < 0.05, Student's t-test, two-tailed. (B–E) Section images of cmlc2:CreER; β-act2:BSNrg1 (Nrg1 on) and control ventricles from 7 to 30 dpt, using animals also transgenic for cmlc2:actinin3-EGFP to indicate sarcomere organization. Brackets indicate cortical muscle, and dashed lines delineate cortical from trabecular muscle. Scale bar represents 100 µm.

