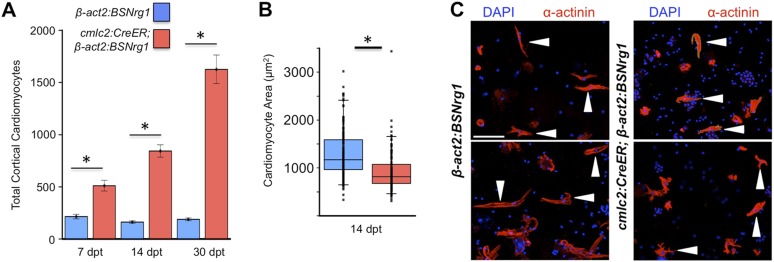
Figure 5. Nrg1 induces a hyperplastic, not hypertrophic, response.
(A) Quantification of total ventricular wall cardiomyocytes in cmlc2:CreER; β-act2:BSNrg1 animals and controls at 7 (n = 8, 9) and 14 dpt (n = 10, 10). Data are represented as mean ± SEM. *p < 0.05, Student's t-test, two-tailed. (B) Quantification of cardiomyocyte area in cmlc2:CreER; β-act2:BSNrg1 animals and controls at 14 dpt. Data are represented as mean ± SD, with all data points represented. *p < 0.05, Student's t-test, two-tailed. (C) Confocal images of dissociated cardiomyocytes from cmlc2:CreER; β-act2:BSNrg1 (right) and controls (left) at 14 dpt (n = 124, 172). Only cardiomyocytes with visible sarcomeres and nuclei were measured. Examples of quantified cells are marked with arrowheads. Scale bar represents 100 µm.

