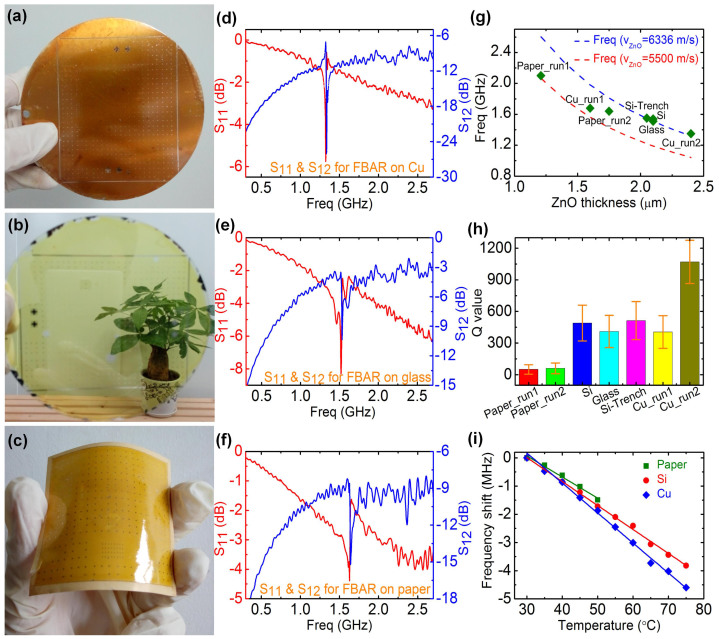
Figure 3. PI-FBARs on different substrates.
(a), (b) & (c) Photographs of the PI-FBAR fabricated on copper plate, glass and paper substrates, respectively, showing the transparency and flexibility for the latter two types. (d), (e) & (f) Reflection and transmission spectra of the PI-FBARs fabricated on copper plate, glass and paper substrate respectively. (g) The resonant frequency as a function of ZnO thickness for FBARs on various substrates, and the two dotted lines are calculated with an idea acoustic velocity (6335 m/v) and a low acoustic velocity of 5500 m/s. The frequency decreases monotonically with the increase in ZnO thickness, and approaches the ideal case at thick ZnO of about 2.0 μm. ‘paper_run1’ and ‘paper_run2’, and ‘Cu_run1’ and ‘Cu_run2’ refer to samples made in different runs with similar conditions. (h) Comparison of the Q-values for FBARs fabricated on various substrates. The Q-values are relatively constant for those on Si and glass substrates, but varies significantly for those on copper and paper substrates, mostly due to the difficulty in controlling the ZnO thickness and quality on these two substrates. (i) Frequency shift as a function of temperature for PI-FBARs on three different substrates, showing a linear relationship for all the PI-FBARs. The TCF is −45.47 ppm/k, −63.37 ppm/k, −54.56 ppm/k for the FBARs on paper, copper and Si substrates respectively.

