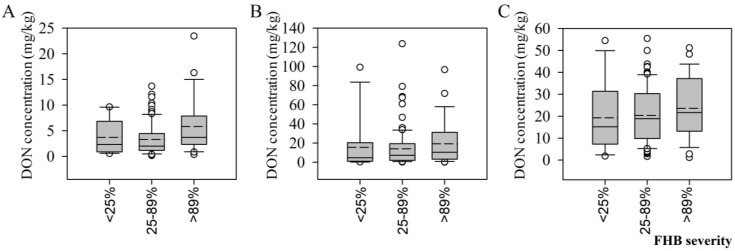
Figure 2.
Box plots of the distribution of deoxynivalenol (DON) levels in wheat tissues ((A): grain; (B): straw; (C): glumes) inoculated with Fusarium graminearum at various levels of Fusarium head blight disease severity. Solid and dashed lines indicate medians and means, respectively. The box boundaries indicate the 75% and 25% quartiles. The whisker caps indicate 90th and 10th percentiles and the circles indicate the 95th and 5th percentiles.

