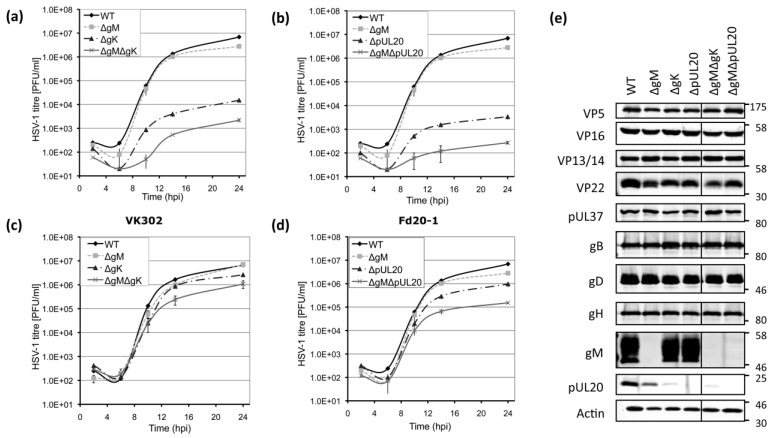
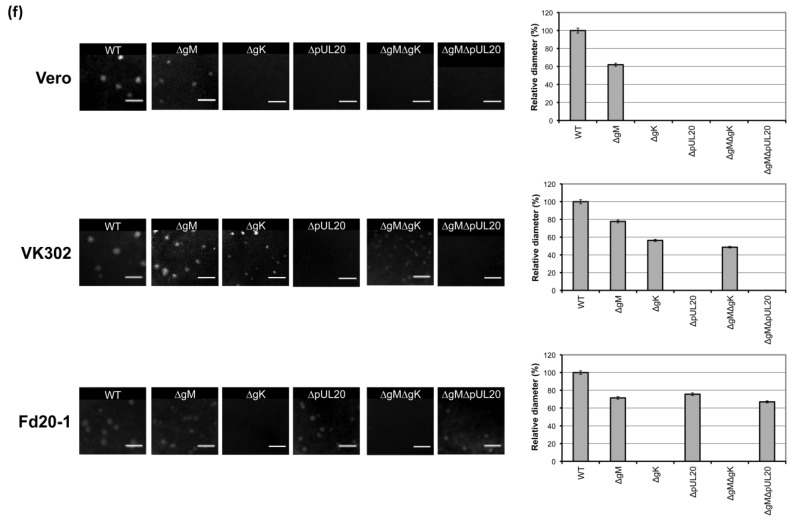
Figure 3.
Replication kinetics, plaque formation and protein expression of recombinant viruses. Single-step growth curves at high MOI (10 PFU/cell) were carried out in Vero cells (a,b); VK302 cells (c); or Fd20-1 cells (d). Total infectious virus yields were determined by plaque assay using the appropriate complementing cells lines. Error bars represent standard errors of the means of triplicate samples; (e) HaCaT cells were infected with the indicated viruses at high MOI (5 PFU/cell) for 24 h before being harvested and lysates separated by SDS-PAGE and analysed by Western blotting using the indicated antibodies. Molecular mass markers (in kDa) are indicated on the right; (f) Plaque formation of the indicated viruses was determined by standard plaque assay on Vero, VK302 and Fd20-1 cells at 3 days post infection. Representative images are shown. Scale bars: 2.5 mm. Plaque sizes were determined by scanning assay plates and measurement using Photoshop. The relative diameters compared to WT are shown. Error bars represent standard error (n = 50).


