Figure 2.
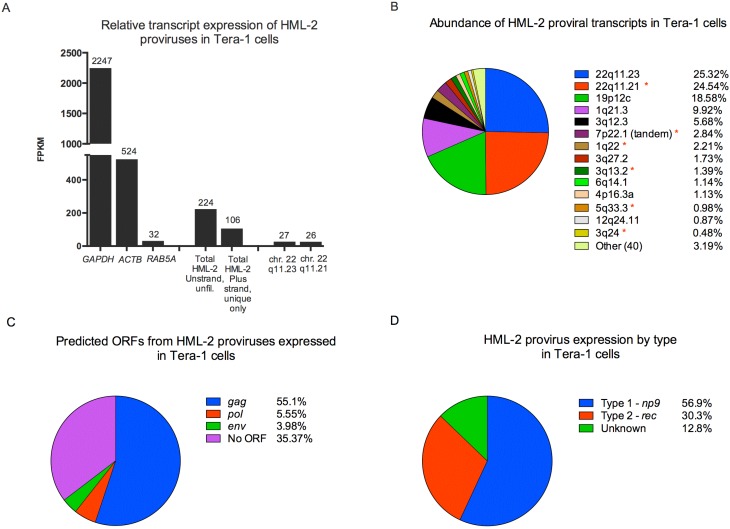
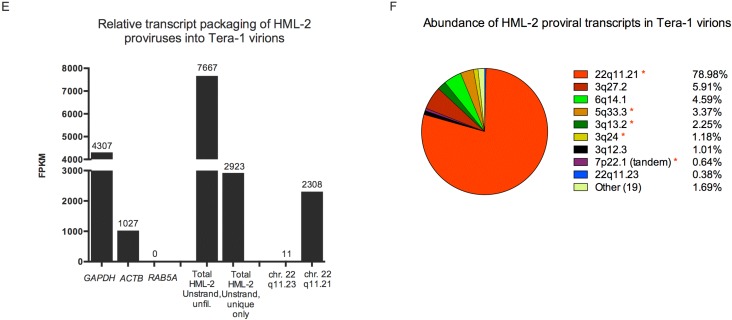
HML-2 expression in Tera-1 cells and virions. (A,B) RNASeq reads originating from Tera-1 cells were aligned to the hg19 build of the human genome and analyzed using the Plus stranded, Unique Only analysis, except as indicated. (E–F) RNASeq reads originating from Tera-1 virions were aligned to the hg19 build of the human genome and analyzed using the Unstranded, Unique Only analysis, except as indicated, due to the input library not being stranded. (A, E) Relative transcript expression values (FPKM) for cellular genes, total HML-2 and the most abundantly expressed or packaged HML-2 transcripts are plotted for Tera-1 cells (A) and Tera-1 virions (E). (B,F) Abundance of transcripts for each provirus in Tera-1 cells (B) and virions (F) is plotted according to (provirus FPKM)/(total HML-2 FPKM) × 100. Proviruses with (*) were predicted to be underrepresented by the in silico analysis, as used in Figure 1. (C) Open reading frames for gag, pol and env were determined for proviruses making up 96.81% of all HML-2 reads shown in Figure 2B. If a provirus had the potential to express open reading frame(s) (ORF(s)), the abundance of the provirus in the cell was allocated to each ORF, as this represents the maximum probability of that ORF being expressed. Splicing was not considered for this analysis. (D) Type 1/2 status was determined for HML-2 proviruses making up 96.81% of all HML-2 reads, listed in Figure 2B. Unknown indicates that the entire pol-env boundary region was not present in the provirus, preventing identification of provirus type.


