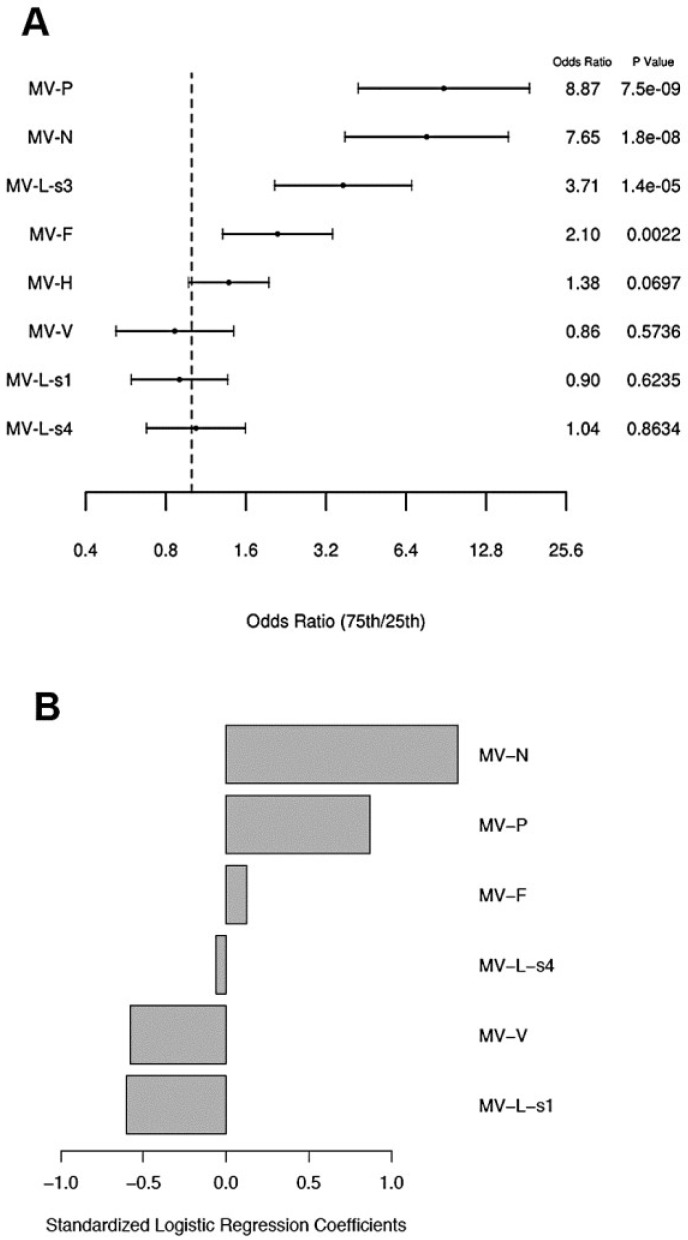
Figure 3.
Logistic regression model results for measles neutralizing antibody response. (A) Univariable logistic regression model results for neutralizing antibody response for each protein antibody measurement. Forest plot displaying the odds ratios and the corresponding confidence intervals and p-values, for the variables (proteome microarray measurements) as predictors for high relative to low neutralizing antibody response from logistic regression models. Odds ratios represent the odds of a subject having a high neutralizing antibody response relative to low when the corresponding protein microarray reactivity measurement changes from the 25th percentile to the 75th percentile. The vertical dashed line corresponds to an odds ratio of 1.0. (B) Multivariable logistic penalized regression model results for neutralizing antibody for all protein measurements. Results from the elastic net logistic regression models for the association of the microarray antibody reactivities (to MV proteins) with neutralizing antibody response. The standardized logistic regression coefficients (1.4 for anti-N microarray reactivity, 0.87 for anti-P microarray reactivity, 0.13 for anti-F microarray, −0.58 for anti-V microarray reactivity, −0.6 for anti-L-s1 microarray reactivity, and −0.06 for anti-L-s4 microarray reactivity) presented are for the microarray measurements that were selected from the model with the validated minimum misclassification error rate (misclassification error = 0.13, C-statistic = 0.92).

