Figure 5.
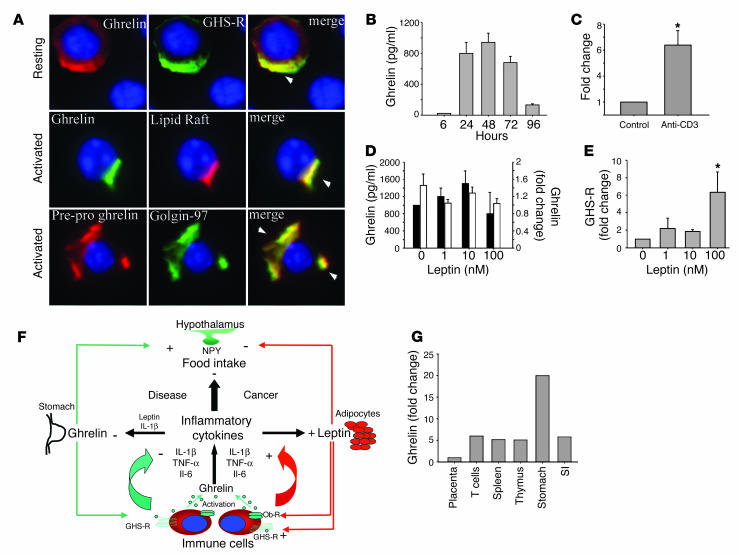
Ghrelin is expressed and secreted from human T cells. (A) Ghrelin and GHS-R coexpression in resting T cells (upper row); activated T cells demonstrating that ghrelin is strongly colocalized in GM1+ lipid rafts (middle row); preproghrelin colocalizes in Golgi bodies in activated human T cells (lower row). (B) Kinetics of ghrelin secretion from anti-CD3 mAb–stimulated T cells. (C) Fold change in ghrelin mRNA levels upon T cell activation as assessed by real time RT-PCR analysis. Values are expressed as mean ± SEM (*P < 0.05). (D) Ghrelin expression was quantitated in T cells stimulated in presence of immobilized anti-CD3 antibody and in the presence or absence of different concentrations of leptin after 24 hours in culture. Fold change in ghrelin mRNA expression (black bars) after normalization with GAPDH and measured by real time RT-PCR. Ghrelin protein production was determined by EIA (white bars). (E) Fold change in GHS-R gene expression after normalization with GAPDH (n = 6), with values expressed as mean ± SEM (*P < 0.05). (F) Hypothetical model for functional role of ghrelin as a signal linking the immune and endocrine systems in control of food intake. (G) Comparative ghrelin mRNA expression in stomach as compared to lymphoid organs. SI, small intestine.

