
Fig. 1.
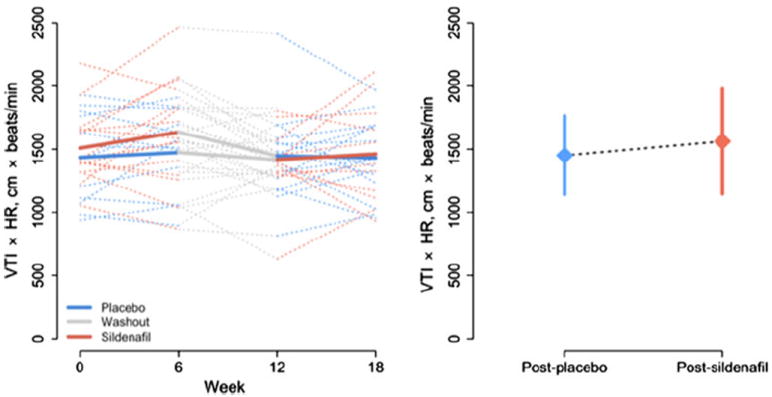
Product of VTI and HR. (Left panel) Observed subjectspecific profiles (dotted lines) and average trend for each treatment group (solid lines) during the study period. (Right panel) Mean ± SD after placebo and after sildenafil
Official websites use .gov
A
.gov website belongs to an official
government organization in the United States.
Secure .gov websites use HTTPS
A lock (
) or https:// means you've safely
connected to the .gov website. Share sensitive
information only on official, secure websites.
Product of VTI and HR. (Left panel) Observed subjectspecific profiles (dotted lines) and average trend for each treatment group (solid lines) during the study period. (Right panel) Mean ± SD after placebo and after sildenafil