
Fig. 2.
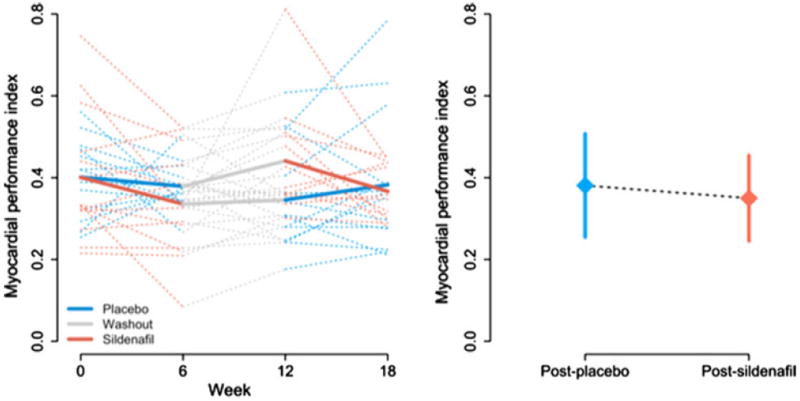
MPI. (Left panel) Observed subject-specific profiles (dotted lines) and average trend for each treatment group (solid lines) during the study period. (Right panel) Mean ± SD after placebo and after sildenafil
Official websites use .gov
A
.gov website belongs to an official
government organization in the United States.
Secure .gov websites use HTTPS
A lock (
) or https:// means you've safely
connected to the .gov website. Share sensitive
information only on official, secure websites.
MPI. (Left panel) Observed subject-specific profiles (dotted lines) and average trend for each treatment group (solid lines) during the study period. (Right panel) Mean ± SD after placebo and after sildenafil