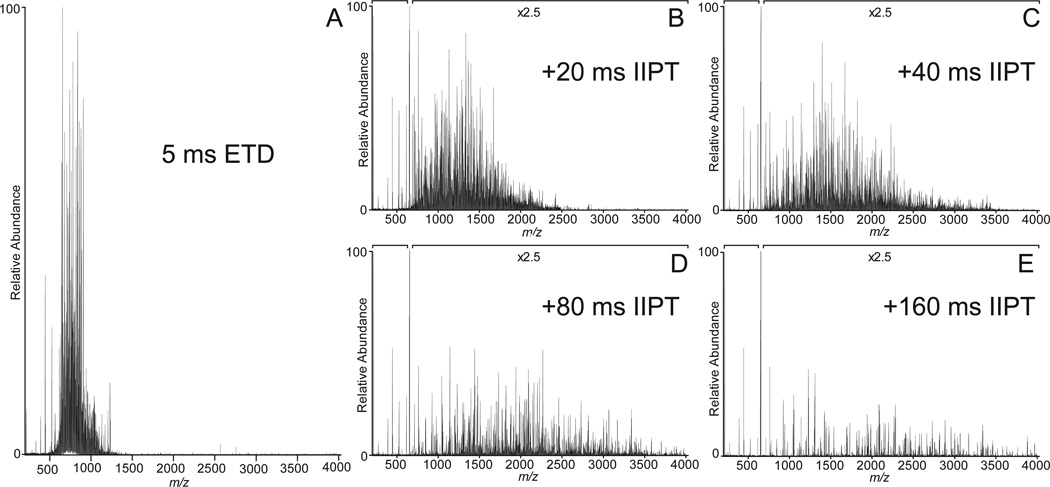
Figure 1. ETD/IIPT MS/MS spectra recorded on intact apomyoglobin.
(A) ETD spectrum recorded on (M+26H)26+ ions from apomyoglobin using a reaction time of 5 msec. (B–E) Spectra obtained by performing IIPT reactions on the ETD fragment ions in (A) for 20 msec, 40 msec, 80 msec, and 160 msec, respectively.

