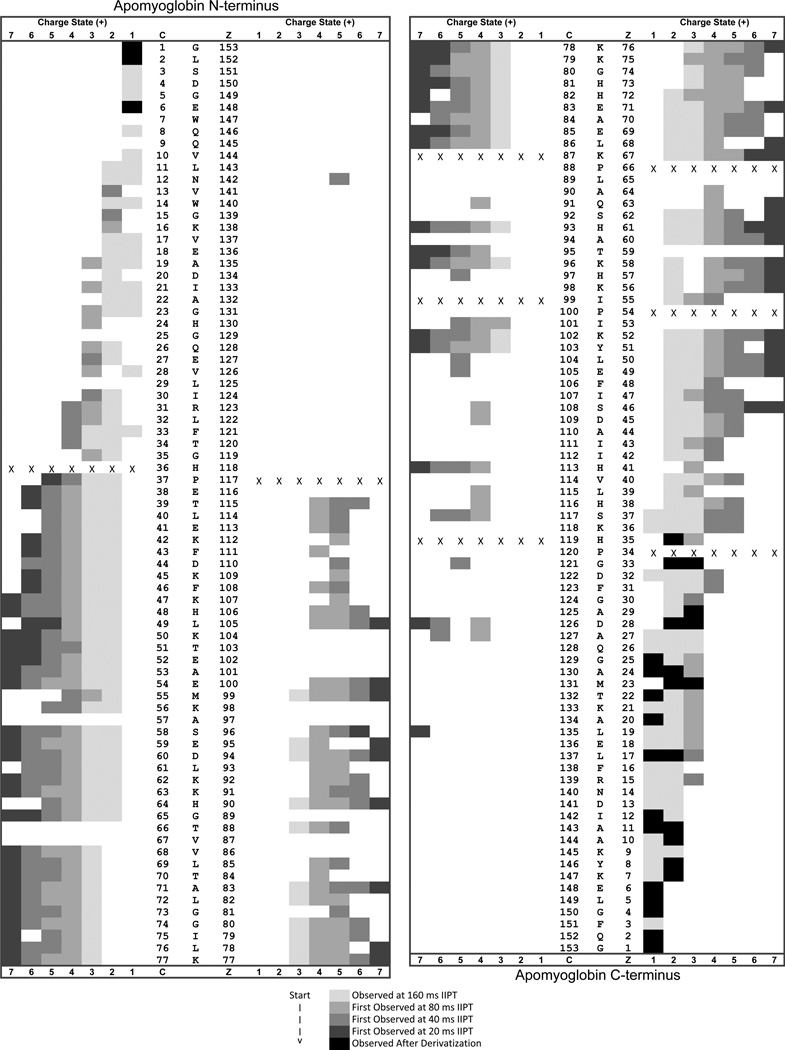
Figure 5. Heat Map of the sequence coverage generated from intact apomyoglobin by using sequential ETD/IIPT reactions.
Fragment ions observed with 5 msec of ETD and 160 msec of IIPT are lightly shaded and dominated by charge states of +1 and +2. More highly charged fragment ions (+3 to +7) that are observed for the first time at shorter IIPT reaction times (80, 40, and 20 msec) are labeled in darker shades. Those shaded in black were only observed following chemical derivatization of the protein.

