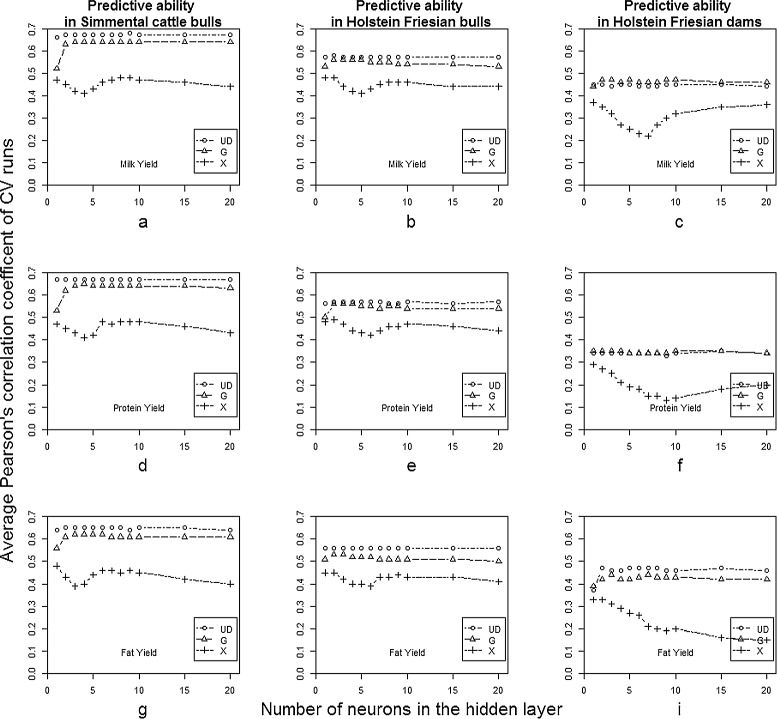
Figure 3.

Comparison of predictive abilities for all scenarios. Different data sets are in the columns, in rows milk, protein and fat yield are shown. Panels (a-h) show the average Pearson’s correlation coefficients over cross-validation runs on the vertical axis, and the number of hidden neurons tested on the horizontal axis. Results of different genomic covariate structures used as inputs (X, G, U D) are presented in each panel.
