Figure 2.

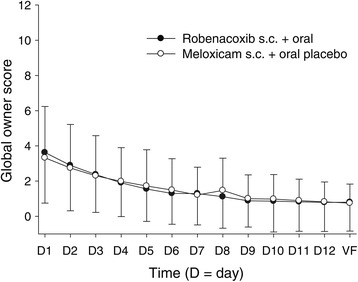
Mean (±SD) global owner scores from Day 1 to the VF. For an explanation of the global owner score (0 = best possible, 12 = worst possible) see Table 4.

Mean (±SD) global owner scores from Day 1 to the VF. For an explanation of the global owner score (0 = best possible, 12 = worst possible) see Table 4.