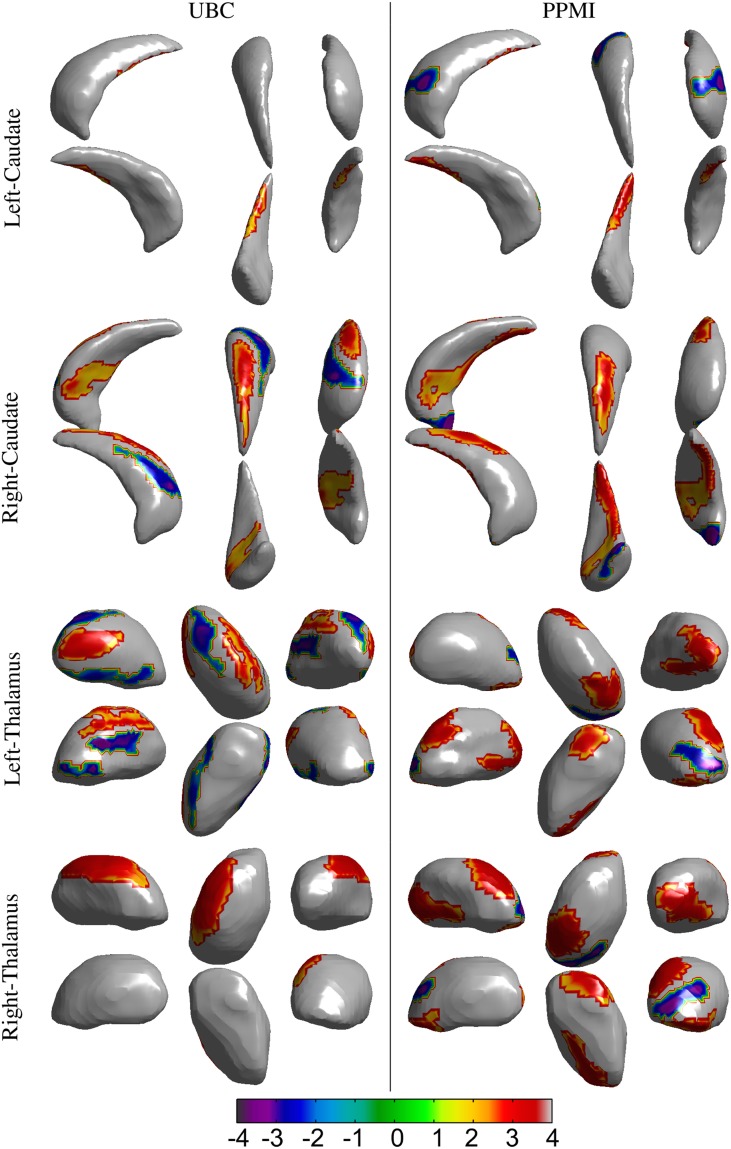
Figure 4.
Results for the vertex-wise group difference analysis of the surface displacement data for the left and right, caudate and thalamus structures in the UBC and PPMI datasets. The colored patches represent the t-values in the areas with statistically significant (p < 0.05) difference between the patient and healthy control group. Gray colored area had no statistically significant difference between the groups. Positive t-value represents lower value in the patient group.

