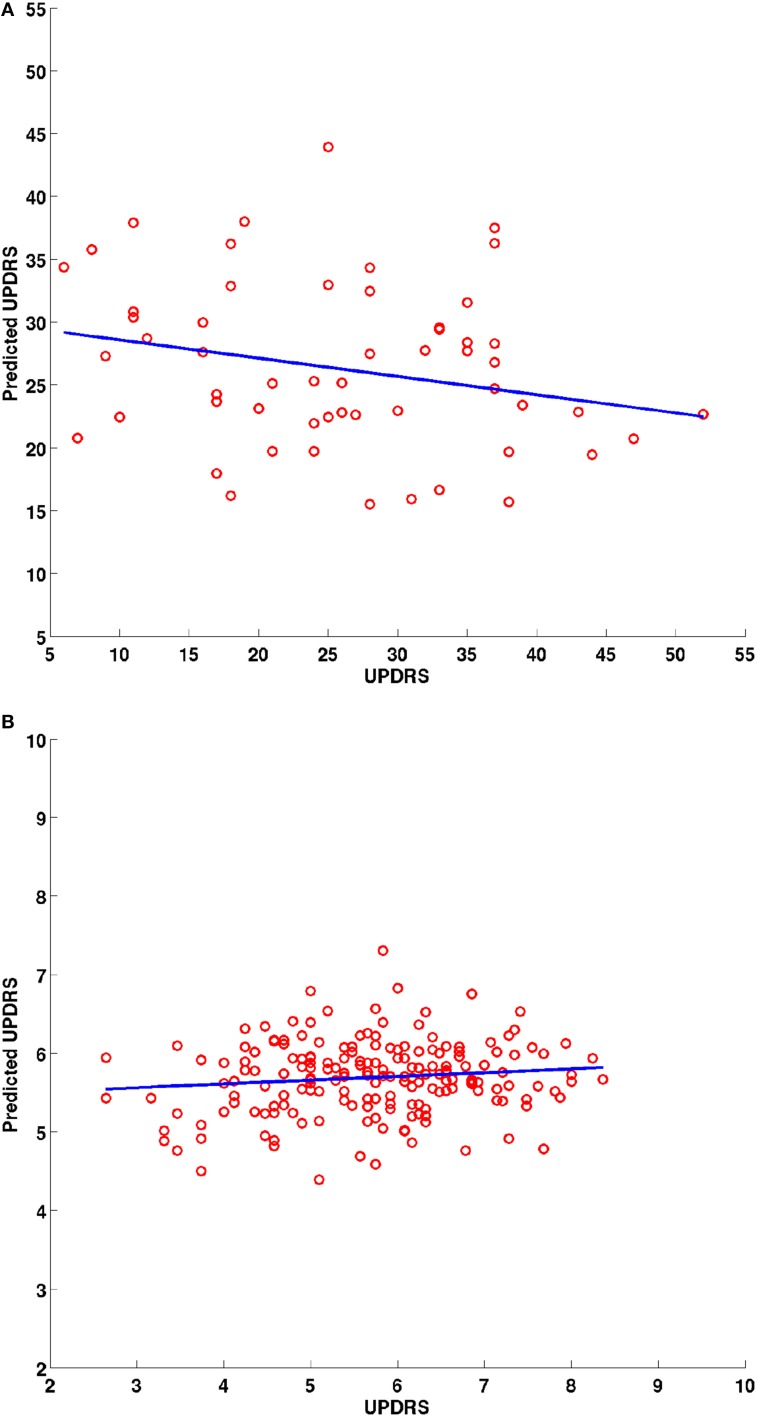
Figure 6.
Scatter plots for the predicted and actual clinical scores from the leave one out prediction experiment using the PC loadings from the PCA decomposition of surface displacements where data from all structures was combined. Experimental data from the (A) UBC dataset and (B) PPMI dataset. Blue line is the least squares fit between the predicted and actual clinical score values.

