Figure 3.
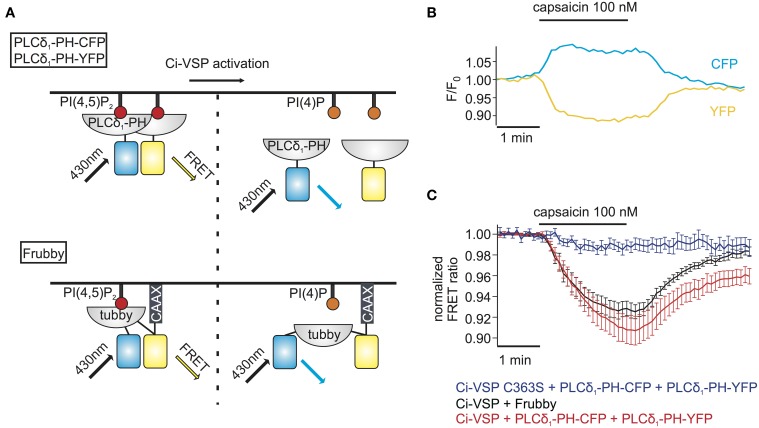
FRET sensors to monitor Ci-VSP activation. (A) Schematic representation of two different FRET sensors used to monitor Ci-VSP activity using photometry. PLCδ1-PH-CFP and PLCδ1-PH-YFP are located at the membrane before Ci-VSP activation and act as FRET donor and acceptor, respectively. FRET is disturbed when the sensors translocate to the cytoplasm after activation of Ci-VSP. Frubby is a construct that allows for intramolecular FRET and as shown in the schema it is held at the plasma membrane via a CaaX motif. (B) Representative trace of fluorescence signal from a cell expressing Ci-VSP, TRPV1 channel, PLCδ1-PH-CFP, and PLCδ1-PH-YFP. Treatment with capsaicin results in an increase of CFP and a decrease of FRET signal. (C) FRET ratio traces of the two FRET sensor systems. Both the PLCδ1-PH–CFP and PLCδ1-PH–YFP system (e = 15) and Frubby (e = 13) show a robust decrease of FRET ratio. No decrease in FRET is observed when the catalytically dead mutant Ci-VSP C363S (e = 6) is used.

