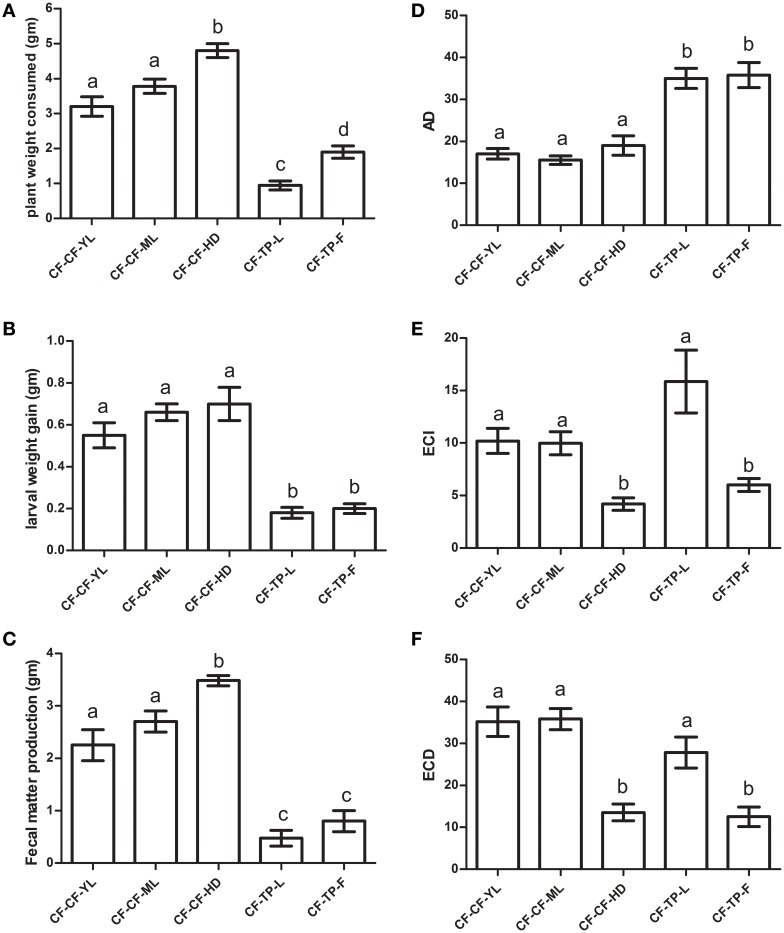
Figure 7.
Comparison of (A) plant weight consumed, (B) larval weight gained (WGL), (C) fecal matter produced, (D) AD (or Approximate Digestibility), (E) ECI (or Efficiency of Conversion of Ingested Matter), and (F) ECD (or Efficiency of conversion of Digested matter) of fourth instar P. brassicae larvae (n = 36) collected from CF fields and transferred to detached tissues (ML, YL, HD/F) of cauliflower (CF) and T. majus (TP) for 12 h in no-choice experiments in the laboratory. The bars represents mean ± SE; the same letters indicate no statistically significant difference (p ≤ 0.05).

