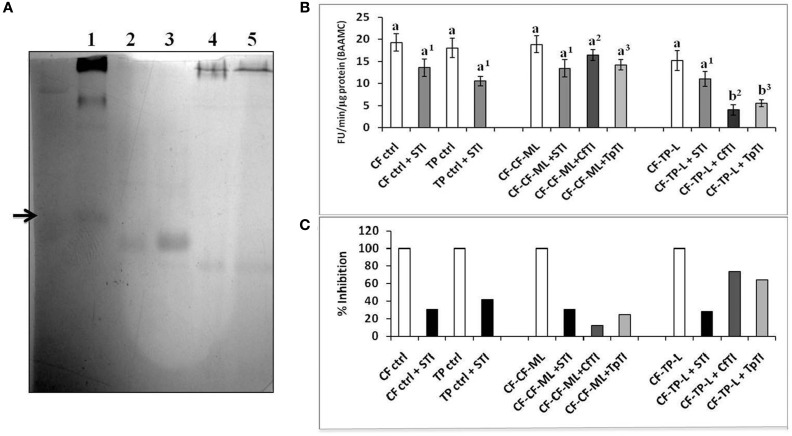
Figure 8.
(A) Reverse zymogram using Bovine Trypsin (2 mg/ml), to detect putative trypsin inhibitors from un-induced cauliflower and T. majus leaves (lanes 2 and 4, 10 μg) and induced, P. brassicae-attacked cauliflower (CfTI) and T. majus (TpTI) leaves (lanes 3 and 5, 10 μg). Lane 1 shows a standard legume trypsin inhibitor. (B) Fluorogenic assays with BAAMC substrate at pH 10 using midgut samples from field collected fourth instar P. brassicae larvae found feeding on mature leaves of cauliflower (CF-ctrl), leaves of T. majus (TP-ctrl) and transferred for 12 h in the laboratory to detached mature leaves of cauliflower (CF-CF-ML) and detached leaves of T. majus (CF-TP-L). Midgut trypsin activities are shown as Fluorescence Units released per minute per microgram total protein. Bars depict mean ± SE; the same letters and numbers in upper case are not statistically significant (p ≤ 0.05). (C) Percent inhibition by STI (black bars); CfTI (gray bars), and TpTI (light gray bars). The extent of inhibition is shown relative to proteolytic activities detected in midgut samples (depicted as 100% in absence of inhibitor).

