Figure 3.

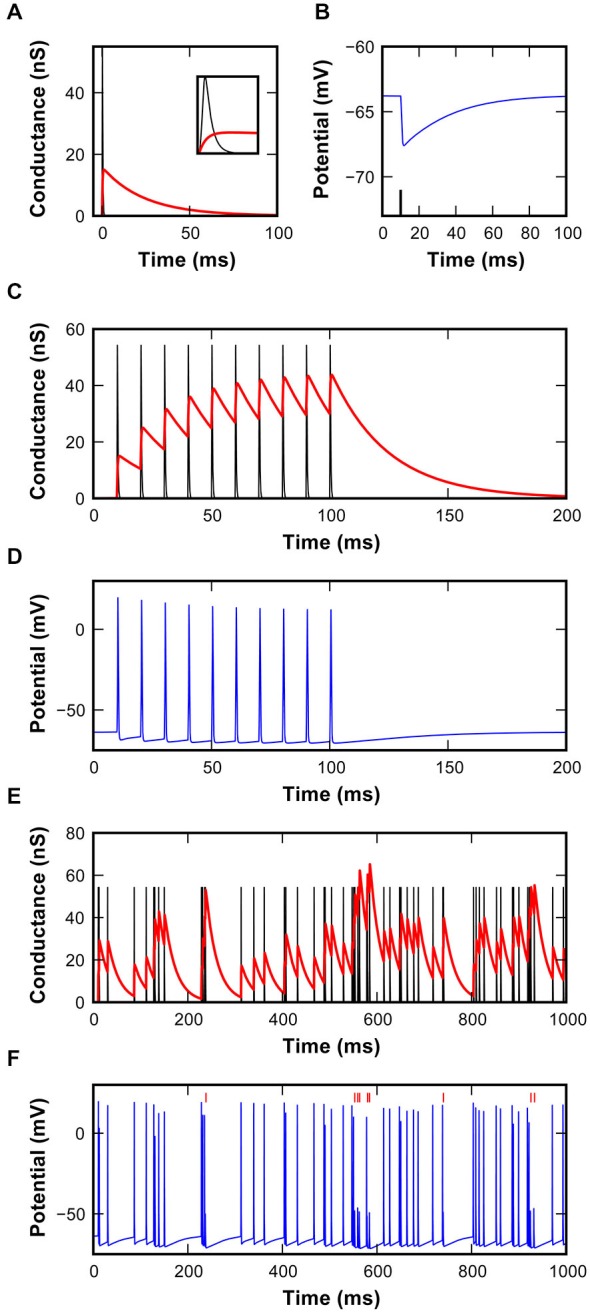
Characteristics of the inhibitory synapse model. (A) EPSG (black) and IPSG (red) waveforms used in the model. Inset shows magnification of the first 2 ms to reveal the rapid excitatory conductance. (B) Hyperpolarizing IPSP in the model resulting from the inhibitory conductance shown in (A), triggered by the spike shown as a black line. (C) EPSG and IPSG resulting from 10 repetitions at 100 Hz using a static inhibitory model. Note the buildup of inhibitory conductance. (D) Simulated membrane potential resulting from the interaction of synaptic conductances shown in (C). (E) EPSG and IPSG during random activations of synaptic mechanisms at the average rate of 62 ± 7 s−1. Inter-event intervals follow a shifted-exponential distribution. (F) Simulated membrane potential resulting from the interaction of synaptic conductances shown in (E). Failures identified by vertical red markers.
