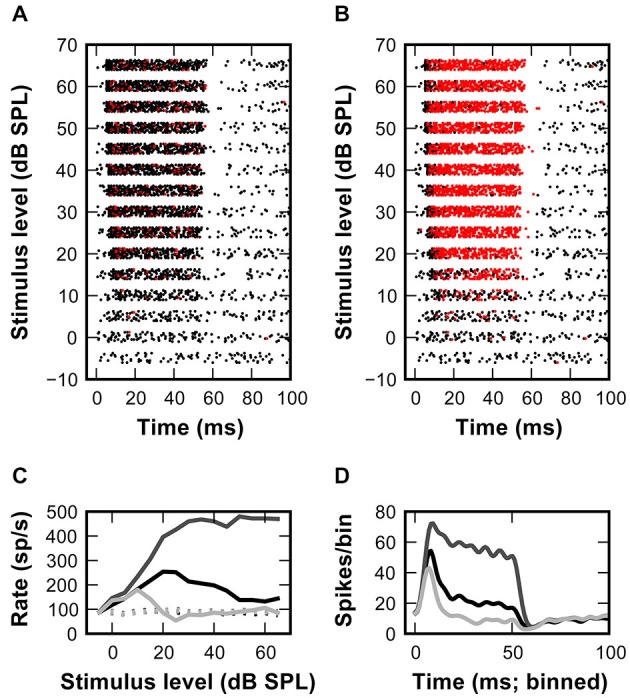
Figure 4.

Inhibitory inputs can account for non-monotonic rate-level functions in the SBC model. (A) Rasterplot of the model response to a set of excitatory synaptic events elicited by the input spike times shown in Figure 1B (APs -black, failures—red). The model SBC follows the in vivo recorded AN input with minimal failures at all stimulus levels. (B) Adding inhibition to the model causes a non-monotonic rate-level function for responses at >15 dB. (C) Output rate-level functions calculated from the responses shown in (A) (dark gray line) and (B) (light gray line). Black line shows in vivo recorded data (D) PSTHs calculated from the data shown in (C).
