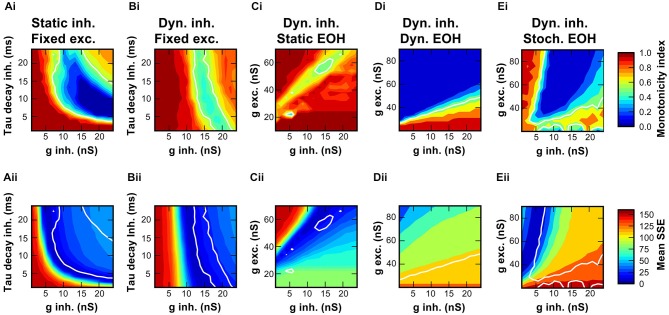
Figure 6.
Range of synaptic properties causing non-monotonic rate-level functions in the SBC model. (Ai,Bi) Maps of monotonicity indices of RLF calculated from simulated responses for 256 combinations of inhibitory conductances (1–24 nS) and decay time constants (1–24 ms). Monotonicity indices are color coded ranging from dark red (MI = 1; monotonic) to dark blue (MI = 0; non-monotonic). White line show the conditions where the MI of the model equals the MI of the recorded unit. Simulations in A were performed with static inhibitory synaptic models, simulations in (B) with the dynamic inhibitory synapse model. (Ci) Amplitudes of excitatory and initial inhibitory conductances were varied in the dynamic synapse model, initial tau-decay was 24 ms. (Di) Simulation in (Ci) repeated with short-term depression of the endbulb included in the model. Note the wider range of excitatory conductance that was tested. (Ei) Simulation in (Di) repeated with stochastically varying endbulb conductance. (Aii–Eii) Maps of similarity between the model and the data for each condition in simulations are shown in (Aii–Eii). Low SSE reveals a good match between the model and the data (dark blue), high SSE indicates a large difference (dark red). White contour line same as in (Ai–Ei).

