FIGURE 4.
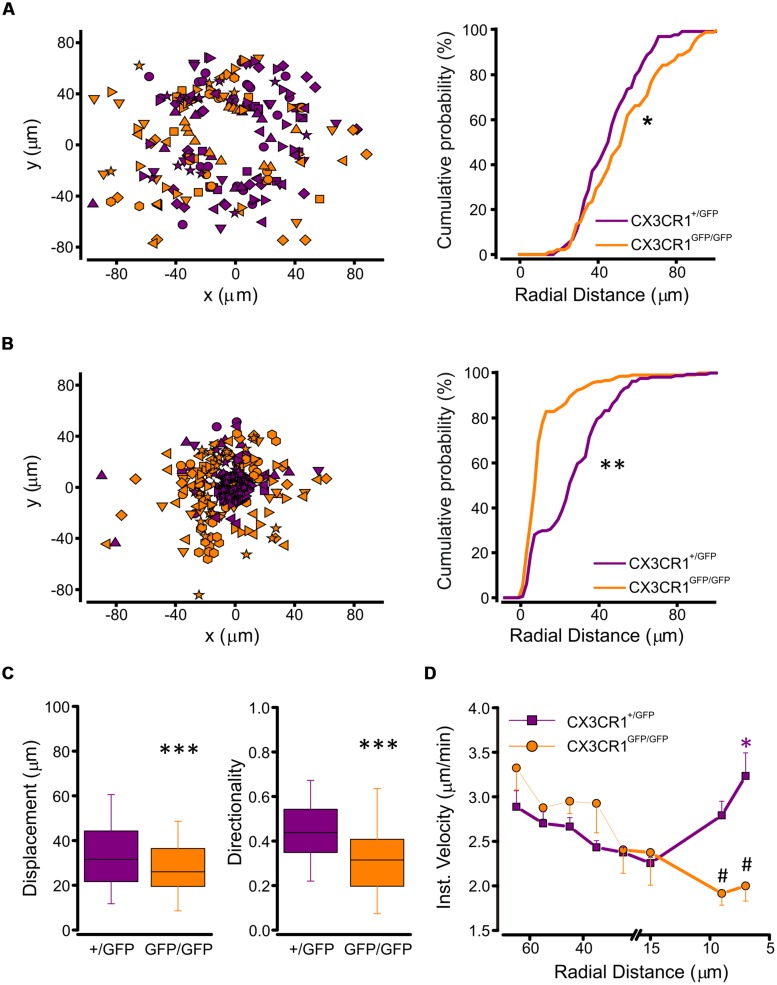
Tracking analysis of single processes in CX3CR1+/GFP and CX3CR1GFP/GFP microglia. (A) Left, plot of spatial x-y coordinates respect to the ATP pipette tip of microglial processes in CX3CR1+/GFP (purple symbols, n = 133 processes/8 fields) and CX3CR1GFP/GFP hippocampal slices (orange symbols, n = 89/8) at start of recordings (t0). Right, cumulative distributions of radial distances of microglial processes from the pipette tip in CX3CR1+/GFP (purple) or CX3CR1GFP/GFP (orange) slices, at t0. Note that CX3CR1GFP/GFP processes are significantly more distant than CX3CR1+/GFP ones (∗p < 0.05, Kolmogorov-Smirnov test). (B) Left, plot of spatial x-y coordinates of CX3CR1+/GFP (purple symbols, n = 209/8) and CX3CR1GFP/GFP (orange symbols, n = 161/8) microglial processes 45 min after ATP application (t45). Right, cumulative distributions of radial distances of microglial processes in CX3CR1+/GFP (purple) or CX3CR1GFP/GFP (orange) slices, at t45. Note that at t45 the majority of CX3CR1GFP/GFP processes do not reach the ATP pipette (∗∗p < 0.0001, Kolmogorov-Smirnov test). (C) Box charts of displacement (left) and directionality (right) of CX3CR1+/GFP (purple) and CX3CR1GFP/GFP (orange) microglial processes. In slices from Cx3cr1+/GFP mice displacement and directionality are significantly higher than in those from Cx3cr1GFP/GFP mice (∗∗∗p < 0.0001, t-test), (D) Correlation plot showing mean instantaneous velocities vs. radial distance of CX3CR1+/GFP (purple) and CX3CR1GFP/GFP (orange) microglial processes. The velocity of CX3CR1+/GFP processes increase significantly 7 mm far from the ATP pipette tip (∗p < 0.001, Kruskal-Wallis One Way ANOVA on Ranks, and p < 0.05 multiple comparison Dunn’s method versus 15, 25, and 35 μm radial distance). Note that in the proximity of the ATP pipette, the velocity of CX3CR1GFP/GFP processes is significantly slower than that of CX3CR1+/GFP processes (#p < 0.01 t-test).

