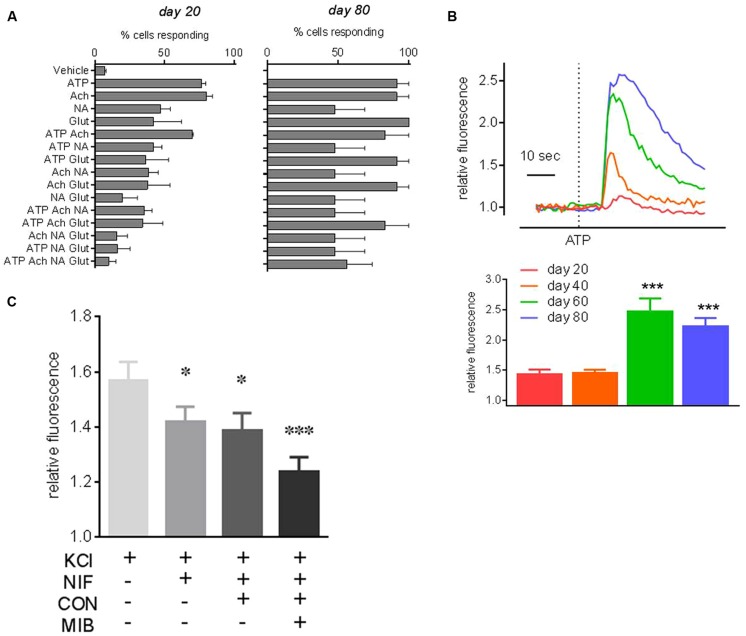
FIGURE 6.
Neuropharmacology of PITX3eGFP/w neurons. Ca2+ imaging of eGFP+ cells revealed functional neurons responding to neurotransmitters changes over time. (A) Shows the percentages of eGFP+ cells, at days 20 and 80 of differentiation, that respond to pharmacological stimuli with increases of [Ca2+]i >10 SD of baseline (mean ± SEM, n = 3). ATP, adenosine triphosphate; NA, noradrenaline; Glut, l-glutamate; ACh, acetylcholine; or V, vehicle. For example, at day 20 very few eGFP+ cells respond to all of ATP, NA, Ach and glutamate, this figure increases to ∼50% of neurons at day 80. (B) Shows typical PITX3eGFP/w neuron [Ca2+]i responses to ATP on days 20–80. Mean fold changes in [Ca2+]i-related fluorescence in response to ATP (±SEM) are shown underneath. (C) Shows the effect of the cumulative addition of calcium channel inhibitors, nifedipine (10 μM), ω-conotoxin MVIIA (0.4 μM), and mibefradil (10 μM) on the KCl-induced change in [Ca2+]i at day 80. KCl (30 mM) control responses in the presence of voltage operated calcium channel inhibitor vehicles did not significantly change throughout the experiment. All data was analyzed using a one way ANOVA with post hoc Dunnett’s test compared to vehicle or day 20 data. (∗ and ∗∗∗ indicates p < 0.05 and 0.001, n = 3).

