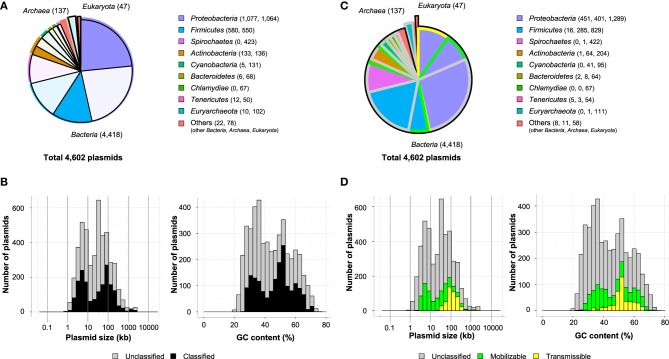
Figure 2.
Ratios of classified plasmids in each phylum (A) and histograms of their size (B, left) and GC content (B, right) are shown. The unclassified plasmids are shown as shaded, and the numbers of classified plasmids and unclassified plasmids are shown in parentheses (A). Ratios of putative transmissible plasmids (yellow), putative mobilizable plasmids (green), and others (gray) in each phylum (C) are shown. Histograms of their size (D, left) and GC content (D, right) are shown.

