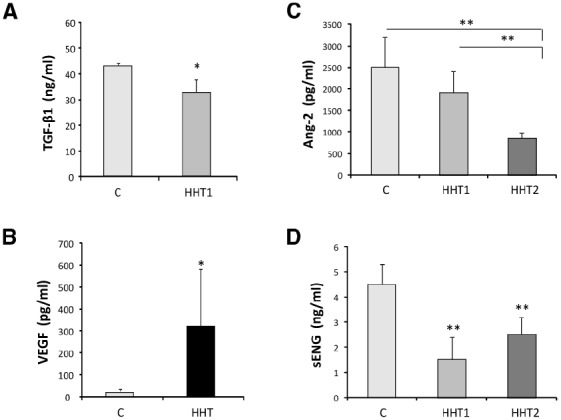
FIGURE 3.

Circulating protein biomarkers in HHT. (A) The levels of TGF-β1 secreted (over 7 h) by 15 different HUVEC with HHT1 were significantly different (*p < 0.05) from the control HUVEC (C) tested in the same experiment. (B) VEGF plasma concentration levels in 25 healthy controls and 18 HHT patients. The mean values and the standard deviation are given for each group (*p < 0.001). (C) Plasma levels of Ang-2 and (D) plasma levels of sEng in healthy donors (n = 38), patients with HHT1 (n = 32) and patients with HHT2 (n = 30). Significant differences between groups (**p < 0.01) are shown. Adapted from Letarte et al. (2005) (A), Sadick et al. (2005) (B), and Ojeda-Fernandez et al. (2010) (C,D).
