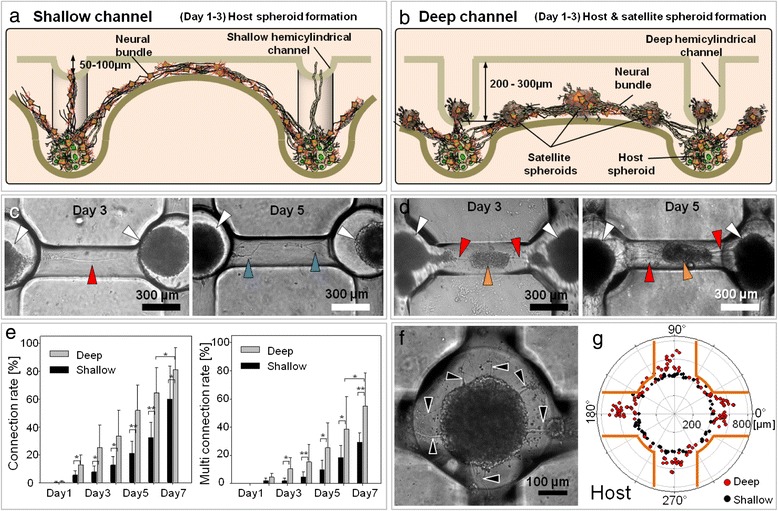
Figure 2.

Comparison of the effect of shape on neural network formation in shallow and deep HCWN systems. (a, b) Schematic illustration of neural network formation on shallow and deep HCWN systems. (c) Optical microscope images of neural network formation in the shallow HCWN system. After neural cell seeding, host spheroids (white arrowheads, day 3) formed in concave wells, and neurite outgrowth from the host spheroid was observed in the shallow hemicylindrical channel (red arrowhead, day 3). Over time, network formation was observed between host spheroids in the shallow HCWN system (blue arrowheads, day 5). (d) Optical microscope images of neural network formation in the deep HCWN system. After neural cell seeding, host spheroids (white arrowheads, day 3) formed in concave wells, and satellite spheroids were simultaneously generated in the deep hemicylindrical channel (orange arrowheads, day 3). Over time, multi-neurite networks formed between host spheroids and satellite spheroids in deep hemicylindrical channels in the deep HCWN system (red arrowheads, day 5). (e) Connection rate of neurites between host spheroids in shallow and deep HCWN systems. Statistical analysis was performed using student’s t-test. Data shown are mean values (%) ± standard error with N=16 (connection rate measurements from four regions with 310 channels) for deep HCWN and N =15 (connection rate measurements from four region with 315 channels) for shallow HCWN (*P < 0.05; **P<0.01). At day 7, the total connection number was measured: 251 networks out of 310 deep HCWN and 110 networks out of 315 shallow HCWN. (f) Optical microscope image of neurite outgrowth from a host spheroid at day 5 (black arrowheads). (g) Direction and length of neurite outgrowth from a host spheroid at day 5 (red: deep (n=10), black: shallow (n=10)). Orange lines indicate the edges of the deep hemicylindrical channel.
