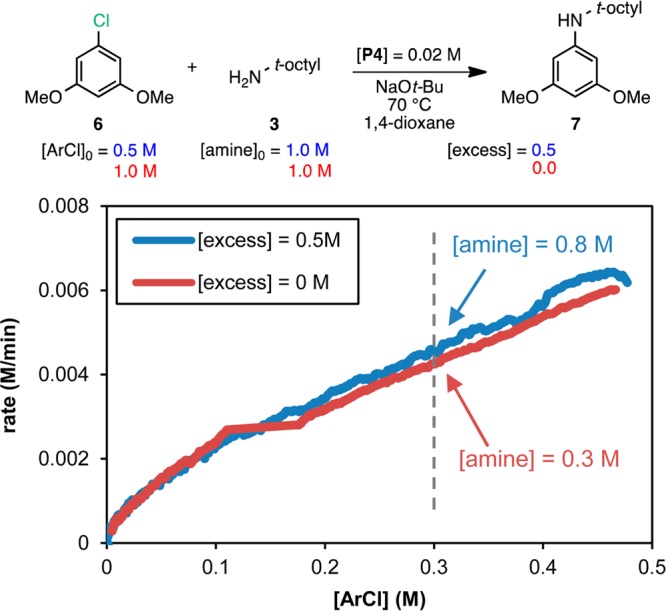
Figure 3.

Reaction progress kinetic profiles for the reaction of ArCl 6 with amine 3 plotted as rate vs [ArCl] over the range of concentrations common to the two reactions. The concentration of amine 3 at the point in the reaction progress marked by the dashed line is shown for each reaction.
