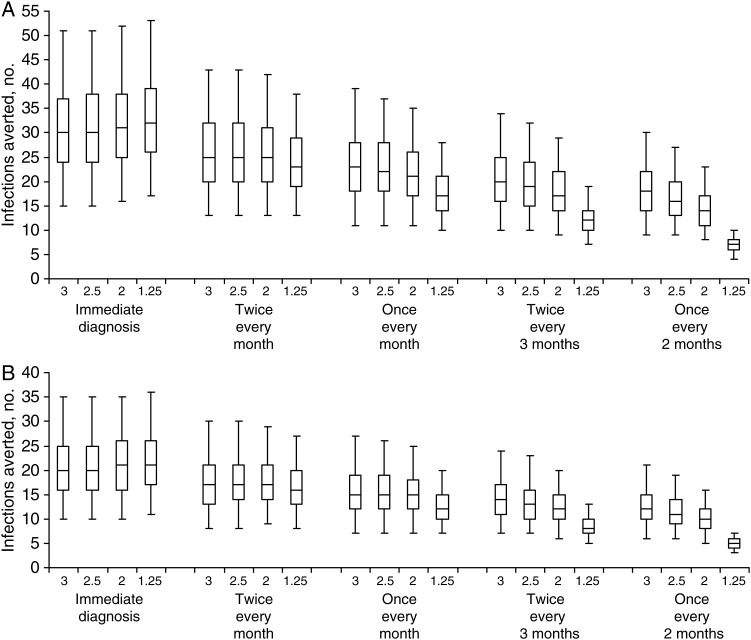
Figure 2.
Numbers of infections averted in the 3 months following human immunodeficiency virus (HIV) infection under different scenarios. The graph shows the median, interquartile range, and 95% range of the estimated number of infections averted with different frequencies of testing, using transmission probabilities for anal sex estimated by Patel et al [15] (A) and Scott et al [14] (B). Numerical labels on the horizontal axis indicate the assumed duration of primary HIV infection (PHI) in months. As the frequency of testing declines, so does the number of infections averted. If the duration of PHI is as short as 1.25 months, then very frequent testing—twice every month—is necessary to avert a substantial number of infections.

