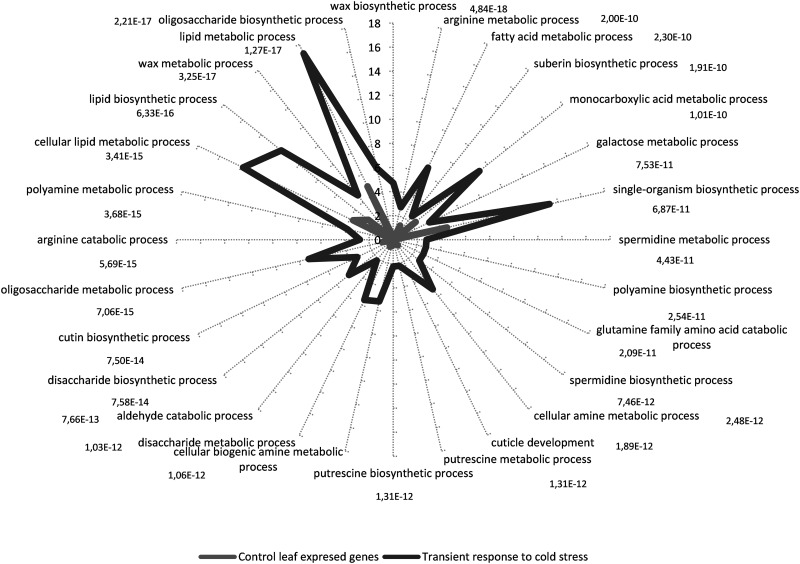
Figure 5.
GO-term-enriched graph of biological process of transient response to cold stress. Up- and down-regulated unigenes, subset of annotated sequences were analysed. Node filter was set at FDR < 1e−7. Bars for early, short-term unigenes are labelled with their corresponding P-values in the Fisher's exact test against the expressed control leaf unigenes.

