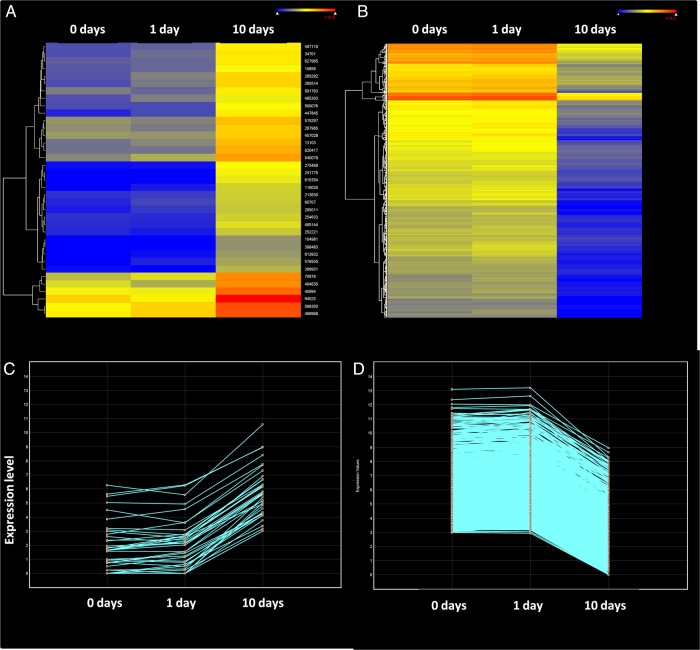
Figure 7.
Unigenes with delayed expression changes in ‘Picual’ plants under prolonged low-temperature stress. Unigenes with 95% significant differential expression at 8-fold change when comparing both 0 and 1 day to 10-day cold-stressed plants. (A) Heat map of the induced genes after long time of low-temperature exposure. (B) Heat map of the repressed genes after a long time of low-temperature exposure. (C) Line graphs showing the expression over time of the delayed over-expressed genes. (D) Line graphs showing the expression over time of the delayed repressed genes.

