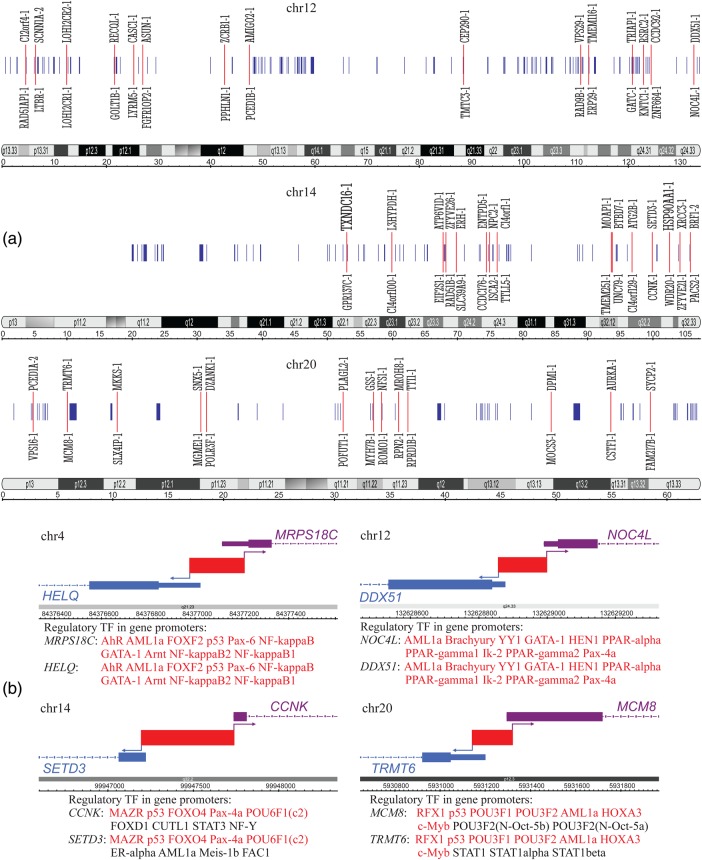
Figure 1.
(a) The distributions of the nearest neighbouring transcription start sites (NN TSS) on the forward and reverse strands across particular chromosomes of the Homo sapiens genome. The cytobands across corresponding chromosomes and relevant length scales are shown below the TSS. The length scale is in megabases. The blue vertical lines correspond to the pairs of NN TSS. The 15 closest pairs on each chromosome are marked by the red lines, and the names of the corresponding NN TSS are indicated. Names shown above the red lines correspond to the TSS on the forward strand, whereas names shown below the red line correspond to the TSS on the reverse strand (names are given according to EPD notation). (b) Particular examples of NN TSS pairs in the H. sapiens genome. The transcriptions factors (TF) participating in the regulation of expression of a particular gene are listed after the name of the gene. The TF that match genes on both strands are marked in red. The data on binding sites for TF associated with genes were taken from http://www.genecards.org.

