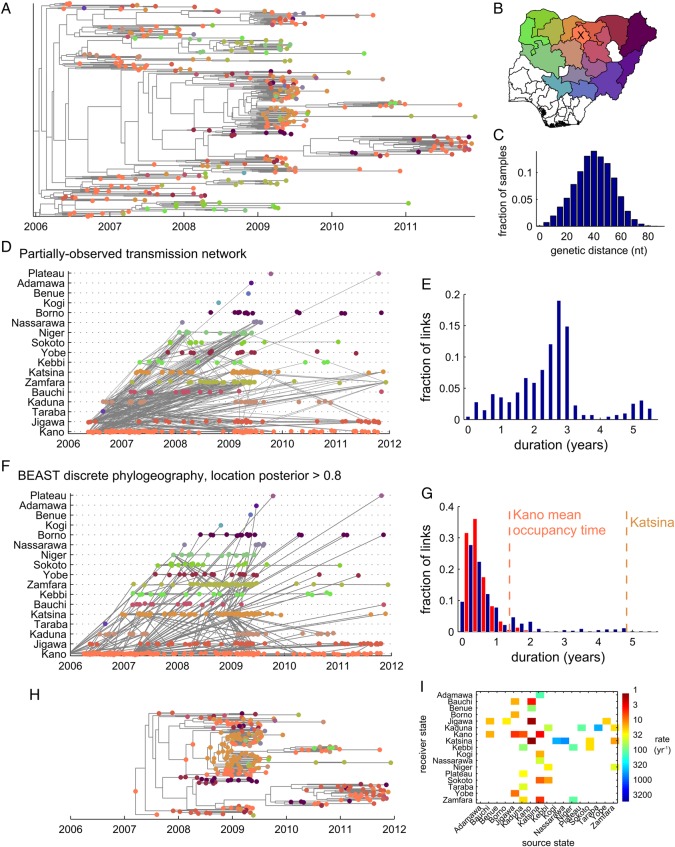
Figure 5.
Phylogeography of polio in Nigeria. (A) Maximum clade credibility tree with poliomyelitis cases (tips) colored by state, as shown on the map in panel B. (B) State colormap. Cases most commonly occur in Kano (center, bright orange, labeled with ‘x’). (C) Genetic distance histogram. (D) Partially-observed transmission network (POTN): cases labeled by color according to location, gray lines indicate POTN links between case pairs. (E) Link duration histogram. The POTN is not informative because links are long compared to the timescale over which the locations are changing in the data and the majority of nodes are disconnected. (F) BEAST discrete phylogeography, maximum clade credibility tree: gray lines indicate POTN links between case pairs; cases labeled by color according to location with internal nodes colored by highest posterior probability location (internal branches have been collapsed to span nodes with posterior location probability >0.8). (G) Link duration histogram. All branches in tree (red); collapsed links between nodes with posterior location probability >0.8 (blue). Shortest mean occupancy times estimated for the continuous-time Markov chain model are from central states Kano and Katsina. (H) Highlight of the clade that dominates after 2010, traced back to the only confident root in Kano in 2007; internal nodes colored by posterior location probability (>0.8 shown). BEAST produces a fully-connected network, but many of the links that extend after 2009 indicate years with no confident ancestral location reconstruction. (I) Mean transition rate matrix. The continuous-time Markov chain model timescales are long compared to the branching and tip location changing timescales, which limits the ability to infer ancestral locations.

