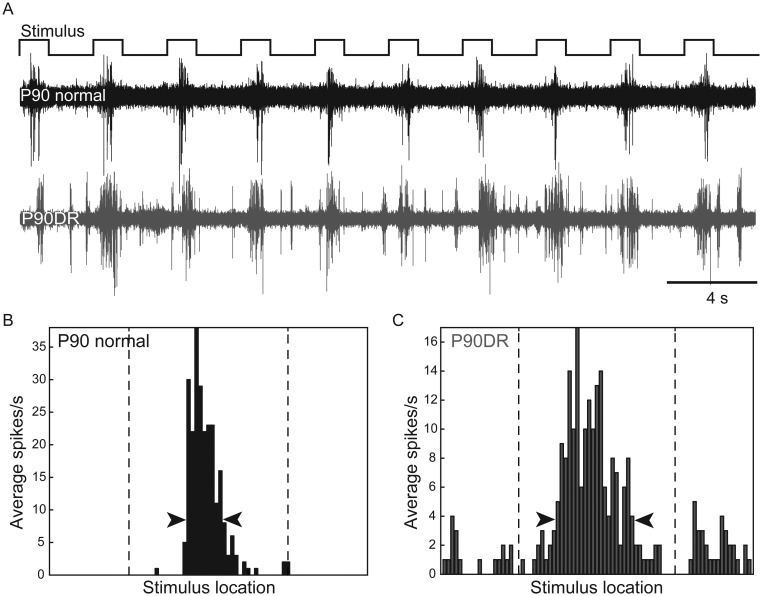
Figure 4.
Examples of extracellular recordings and RF plots from P90 normal and P90DR V1. (A) Typical responses to a moving bar. The visual receptive field (RF) of a neuron in the P90 normal case (black trace) is narrower compared with that of a neuron in the P90DR case (gray trace). RF PSTHs of the P90 normal (B) and P90DR (C) shown in A, after single-unit isolation. The dashed vertical lines represent onset and offset of the moving bar stimulus. The arrowheads indicate the 20% peak threshold used to calculate RF width.

