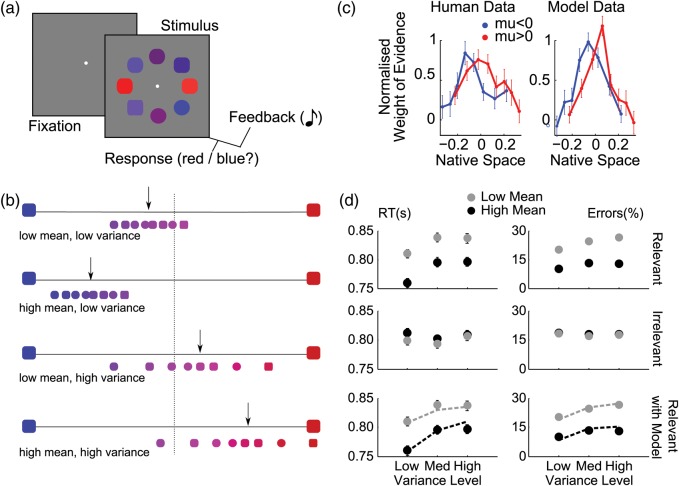
Figure 1.
Task, behavior and modeling. (a) Schematic representation of a trial: a white central fixation point, was followed after 500 ms by the stimulus array, which participants categorized based on either the average shape (square vs. circle) or average color (red vs. blue) across all elements, with auditory feedback. (b) Example distributions of array elements for different combinations of mean and variance trials as labeled. The x-axis shows the feature space for the color task, with the larger blue and red squircles at each extreme representing color values of −1 (blue) and +1 (red). The smaller squircles show example stimuli for the color task drawn from a distribution with low mean, low variance (upper panel), high mean, low variance (upper middle panel), low mean, high variance (lower middle panel), and high mean, high variance (lower panel). The black arrow indicates approximate location of the distribution mean and the central dashed line is the category boundary. Thus, in these example trials arrows to the left indicate of the central line indicate that the correct response is “blue” and arrows to the right of the boundary should elicit a “red” response. (c) Coefficients from a logistic regression in which decision-relevant values, “ranked” in each trial, predicted observers’ choices, separately for blue/square (blue) and red/circle (red) stimulus arrays. Higher decision weights appear for inlying versus outlying elements. The abscissa indicates the average decision value of the elements in each rank, in native space. (d) Response times (RTs, left panels) and error rates (right panels), as a function of the mean and variance manipulations. Low mean and high variance correspond to high uncertainty. Top row: effect of the task-relevant manipulations. Middle row: effect of the irrelevant dimension. Bottom row: best-fitting model data (dashed lines) overlaid on the human data for the task-relevant manipulations. The model was fitted to errors only, and RTs are predictions.

