Figure 2.
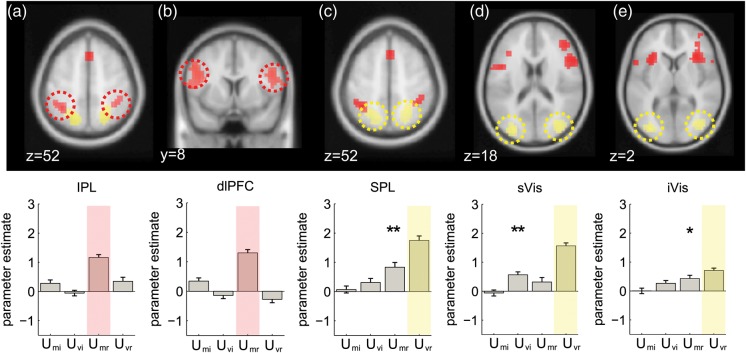
Imaging results from dorsolateral prefrontal, parietal and visual cortices. Top row: voxels where BOLD activity was responding to positively correlated with mean-related uncertainty (UMr, in red), and positively correlated with variance-related uncertainty (UVr, in yellow). All activations are rendered on the template brain of the Montreal Neurological Institute with an uncorrected threshold of P < 0.001 (see text and tables for full list of activation and peak coordinates). Bottom row: average parameter estimates from a 5 mm sphere centered on the peak activation from the cluster highlighted with a dashed ellipse, for regressors encoding uncertainty due to the mean and variance for relevant and irrelevant dimensions. Stars indicate significance: *P < 0.05, **P < 0.01, ***P < 0.001. Red and yellow shading denotes the condition used to define the ROI. (a) Voxels in the inferior parietal cortex (IPL) responding to UMr. (b) Voxels in the dorsolateral prefrontal cortex (dlPFC) responding to UMr (c) superior parietal cortex (SPL) showed a positive correlation with Uvr (and UMr, see bar plot). (d and e) We subdivided a large region of visual cortex showing activity positively correlated with Uvr into superior (sVis) and inferior (iVis) regions.

